Introduction
Consumers often have numerous options within a product category, which affords them the ability to selectively choose products based on individual preferences shaped by individual experiences. Enjoyment of a product is often a multi-faceted sensory experience, which can make it difficult for consumers to articulate why they like, or do not like something. Scholarly approaches to the culture of consumption examine the meanings, beliefs, and social structures that give shape to consumption, including those aspects of culture that impact preference and choice1. As affluence and choice increase in societies, consumers are able to choose products that are reflective of their individuality2 and, identify products based on individual preferences that is an expression of an outward identity, and also a search for self-identity3. Wine is an important and appropriate way to study this form of consumption culture. While choices are numerous, all wine is made from the same thing, fermented grape juice; everything else, including the symbols and meaning of wine, relate to culture4 and related modes of consumption. Wine consumers often attach symbolic value to specific qualities during the purchase process, and consumption based on their own personal experiences5. This symbolic achievement can be an internal process as individual wine drinkers choose products based on their own self-identity formed through their cultural experiences6.
Wine labeling also plays an important role in the consumption process. When a prospective wine drinker walks into a wine store, there may be thousands of options available to choose from. To narrow down the choices, wine drinkers often rely on the label to make assumptions about the wine inside the bottle7. With so many unique labels available, consumers can draw on past information, experiences, and sensory cues to help make a product selection. Therefore, the wine label also plays an important role in the culture of consumption as consumers look for symbols and meaning that they personally identify with8, and choose products that are reflective of a desired identity9.
Five distinct research phases are used to address the central research question: do wine label visual sensory cues influence the culture of consumption and the sensory taste of wine? The research takes place in the Okanagan Wine Region of British Columbia in Canada, where two online surveys, two in-person sensory evaluation tests, and in-depth interviews were conducted to explore the individual sensory impact of constructing an identity through consumption. Specifically, this research explores how symbolic representation of consumer identity on wine labels influences the sensory experience of wine.
Theoretical Framework
To understand how wine drinkers are shaped by their experiences to develop associations with sensory cues that create biases that influence how the wine will taste, this study uses consumer culture theory (CCT) as a theoretical framework. CCT views consumers as individual identity seekers navigating opportunities in the marketplace that provide a message that embraces who they are based on personal experiences10. In terms of wine consumption, CCT enables researchers to examine contexts in which the consumer acts as an explorer constructing their own identity based on market-based resources11.
As a multi-faceted sensory experience12, wine can illustrate cultural differences while exposure to a variety of stimuli can lead to cross-modal sensory associations when consuming a product like wine13. Cross-modal associations occur when senses overlap until one sensory experience is systematically associated with a resulting sensory experience14. As consumers have more experiences with wine they want to consume, these exposures generate sensory cues for consumer preference that create an expectation for how the wine should taste15. As a result, methods in sensory evaluation were critical to addressing the research questions in this study and understanding how one sense can impact another.
When evaluating wine options, the label is often the first thing consumers see and is used to make a judgement on product trial. Each individual will make associations between the visual cues they are viewing and different experiences they have had with wine (Parr et. al., 2003). When labels become associated with specific sensory values, they are used to discriminate between choices16 and these sensory associations may impact preferences for different sensory qualities17. This research focuses on visual cues that have extrinsic variables, which are the verbal and visual cues that can be changed on a label without changing the product18. This includes items such as colour, design, images, or characters that help form the brand image of the wine.
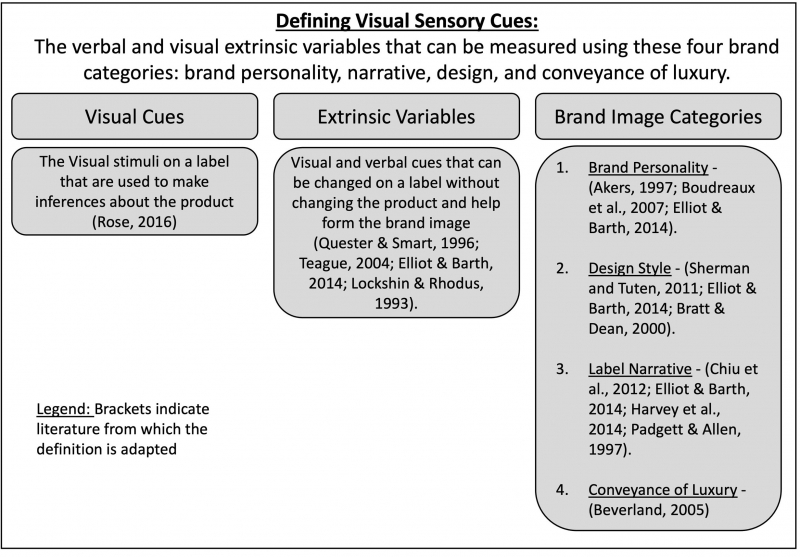
Within this study, the verbal and visual variables that make-up the extrinsic variables on a label were measured using four main categories that have been shown to influence consumer preference. This includes brand personality19, Label narrative20, design style21, and conveyance of luxury22. The verbal and visual extrinsic variables that can be measured using these four categories are referred to as visual sensory cues (Figure 1).
Figure 1: Illustration showing how visual sensory cues are defined for the purpose of this study.
Methods
Phase 1: Online Survey to Classify Wine Labels
Within the academic literature that explores verbal and visual extrinsic variables on a wine label, four key categories have been demonstrated to differentiate wine labels and influence consumer preference - brand personality, label narrative, design style, and conveyance of luxury (See Figure 1 for a detailed explanation). The purpose of this first phase of the research is to confirm distinction between the wine labels used in subsequent phases across these four brand categories. Seventeen label images were provided by a wine company named ©Terrabella Ltd. in the Okanagan region of British Columbia Canada for this research and all information directly related to the product or processing, including grape varietal, vintage, region, producer, and wine style, was removed so that only the extrinsic variables remained. An online quantitative survey was programmed in Qualtrics, a survey creation software. There were 200 responses to the survey, which included 194 Mturk respondents (professional Amazon survey-takers) that were each compensated $0.20 and 6 respondents recruited from posters on the UBC Okanagan campus that were not offered compensation. Each respondent evaluated a randomly selected subset of 9 labels to ensure every label was seen at least 100 times, and the average response time was 11:01 minutes.
Using the procedure outlined by Amerine and Roessler23, a one-way, or single classification analysis of variance was conducted. To determine which means were significantly different, a multiple comparison technique, Fisher’s least significant difference test (LSD) or a t-test of proportions was conducted using Minitab®18 software.
Phase 2: Online Survey of Label Identification with Wine Drinkers
A second online survey was conducted to determine how wine drinkers identify with wine labels. The online survey was programmed in Qualtrics, a survey creation software and ©Terrabella Ltd. sent the survey link to their winery mailing lists containing 3,320 wine consumers. There were 164 respondents to the survey. The average response time was 15:40 minutes and there was no compensation offered. Each respondent evaluated their ability to identify with each label, from a randomly selected subset of 9 labels from the 17 labels used in phase 1. For each label, respondents were asked if they personally identified with it, familiarity, willingness to pay, purchase intention, expected taste, and likes or dislikes of the label.
To understand the degree of association between a label identified with, and both willingness-to-pay and anticipated taste, a correlation analysis was conducted following the procedure outlined by Meilgaard, et al.24. To test the strength of the relationship, the correlation coefficient (r) was calculated and evaluated to determine if it was statistically significant. Additionally, the mean willingness-to-pay for labels identified with or not identified with are compared to typical spend on wine. A total of 1,476 label views were evaluated and a single classification analysis of variance was conducted in Microsoft Excel to determine any significant difference between two or more means25.
Phase 3: Triangle Test
A triangle test was used to determine if wine drinkers are able to discriminate between wines using only taste. The hatch winery in the Okanagan region of British Columbia Canada, and member of the Terrabella group of wineries, provided two bottles of two different wines to be used in the triangle test (Table 1). The wines were chosen because they were the same varietal (Pinot Noir), same vintage (2015), same winemaker (Jason Parkes), and similar alcohol % (14.1%-14.5%). However, the wines used in the triangle test are vastly different in valuation. The first wine used, Black Swift, is harvested with a much smaller yield further south in the Okanagan wine growing regions. It is aged in new French oak for 18 months and sells for $59.99 CDN. In contrast, the second Pinot Noir, Ross 3.0, is a higher yield Pinot Noir grown within the Golden Mile Bench appellation and is aged in second-use oak for 10 months and is sold for $19.99 CDN. A total of 36 participants received three coded samples with approximately 20 ml of wine in each glass and were instructed that two of the wines are the same, and one is different. Tasting from left to right, the participants tried the samples and attempted to identify the odd sample. As compensation, participants received a complimentary wine tasting – $5 value.
Table 1.
Phase 4: Consumer Affective Test
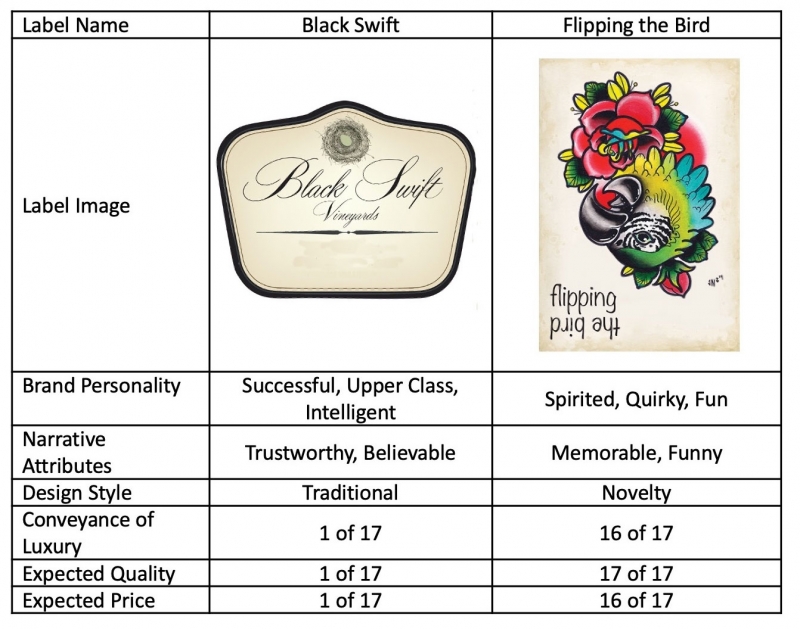
Phase 4 of the research is designed to effectively understand if consumer label identification can impact the perceived taste of the wine. A consumer affective test with central location was used following the procedure outlined by Poste et al.26 and Meilgaard et al27. The same wines from Phase 3 and two labels from Phase 1 that had unique attribute profiles (Table 2) were used. The research partner, ©Terrabella Ltd., enabled potential participants to be intercepted at one of their wineries, Perseus Winery. Each participant received two coded samples with approximately 12.5 ml of wine in each glass that were aligned with two labels according to a randomization plan. Starting with the sample on the left, they were then asked to indicate how much they believed each label was “for someone like me” to establish if they identified with the label, overall like/dislike, how much they would be willing-to-pay to compare to typical spend, and purchase intent for comparison. A total of 92 participants that identified with a label and liked at least one wine were used for analysis. As compensation, participants received a complimentary wine tasting, a $5 CDN value.
For analysis, the mean willingness-to-pay for labels identified with or not identified with were compared to typical wine spend. A single classification analysis of variance was conducted in Microsoft Excel to determine if there was a significant difference between two means28. Secondly, the proportion of respondents that spend more than typical when they identify with the label, was compared to those that spend more than typical when they do not identify with the label. Following the procedure outlined by Meilgaard et al.29, a t-test of proportions was conducted using Minitab®18 software. Third, using a t-test of proportions conducted in Minitab®18 software, the proportion of respondents that liked the wine in the label they identified with was compared to the proportion that liked the wine in the label they did not identify with. Fourth, a single classification analysis of variance was conducted in Microsoft Excel to determine if there was a significant difference between the overall liking score for wines with labels identified with and wines with labels that were not identified with.
Table 2.
Phase 5: In-Depth Semi-Structured Interviews on the Sensory Experience of Wine
In-depth interviews are conducted to better understand the sensory experience of wine among consumers, and the variables that impact preferences and anticipated taste. Ten semi-structured interviews were conducted with wine drinkers that were recruited from a list of 96 people that provided written permission to recontact them after participating in the online survey in phase 2. Each participant was asked to elaborate on the variables of the wine label that influence their sensory experience of wine and provide context on why this is the case. The interviews were approximately 1 hour in length and took on a fluid conversational flow depending on the views and interests of each subject. All interviews were transcribed, and the contents of the interview transcripts were assessed for manifest content by coding in NVivo, which generated the key themes and narratives.
Results
Phase 1: Online Survey to Classify Labels
This phase of the study established that the 17 labels were significantly different at p≤0.05 across all of the extrinsic variables that impact a wine drinker’s purchase decisions. Importantly, this research does not equate a low or high rating on any attribute as positive or negative, but rather different parts of the scale for consumers to identify with. This result ensures that there is a good mix of all the elements within each variable that wine drinkers may find appealing. It is, therefore, an appropriate mix to determine if someone identifies with a label, and what impact that has on cross-modal associations between sensory experiences.
Phase 2: Online Survey of Wine Label Identification with Wine Drinkers
This phase of the study demonstrates that identity-seeking wine drinkers are willing to spend more money on a wine if they identify with the label. Additionally, wine drinkers are more likely to anticipate a wine will taste better if they identify with the label. The correlation coefficient (r) between willingness-to-pay and identifying with the label is 0.5071 and the result is significant at p≤.001. Respondents are also significantly more likely to spend more money on a label they identify with than one they do not identify with (p≤0.05). The correlation coefficient (r) between expected taste and identifying with the label is 0.8093 and the result is significant at p≤.001. Wine drinkers are significantly more likely to expect the wine to taste better for a label they identify with than one they do not identify with (p≤0.05). This phase of the research is able to demonstrate that the driving force of identity-seeking consumers is the representation of who they are in the visual sensory cues on the label, which, in turn, biases their anticipated taste and how much they are willing to spend.
Phase 3: Triangle Test
Of the 36 participants in the triangle test, 16 correctly identified the odd sample. Using the table of significant values for a triangle test from Roessler et al. (1978, p. 941), a minimum of 18 respondents are required to establish significance at p≤0.05, indicating wine drinkers were unable to detect the sensory difference between the two wines. These results demonstrate that wine drinkers are unable to discriminate sensory differences using only taste, and provides strong evidence that wine is a multi-sensory experience that relies on the senses informing each other about what tastes good. If a wine drinker relies on taste alone, there is no significant difference between a $20 and $60 bottle of Pinot Noir to the average consumer. Additionally, if wine drinkers indicate that one of the two wines from this research tastes better after viewing a label they identify with in the subsequent phase, it will provide strong evidence that the visual sensory cues on a label impact the actual taste of the wine.
Phase 4: Consumer Affective Test
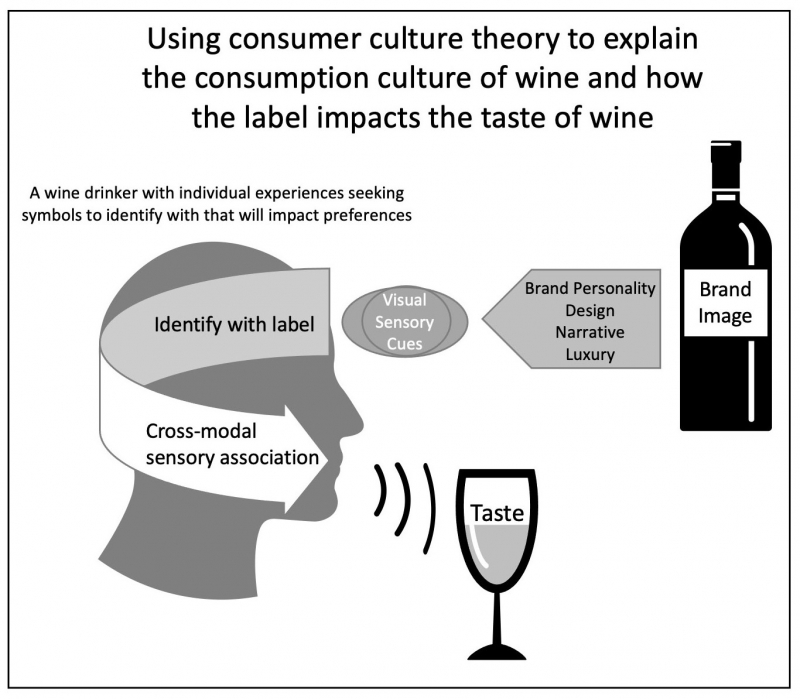
The results of Phase 4 demonstrate that identification with the label impacts the taste of the wine and that a greater proportion of respondents were more likely to spend more than their typical spend if they identified with the label. Labels identified with had a willingness-to-pay ($20.82) that was not significantly different than typical spend ($22.46). However, labels not identified with, had a willingness-to-pay ($19.55) that is significantly lower than a typical spend at p≤0.05. Secondly, those who identify with the label are significantly more likely at p≤0.05 to spend more than they typically spend (59%, compared to 41% among those that do not identify with the label). Thirdly, a wine drinker is significantly more likely to like a wine if they identify with the label at p≤0.05 (53%, compared to 29% for a label not identified with). Fourth, respondents liked wine more when they identified with the label (4.6, compared to 4.2 on a 7-point scale). Identification with the labels was equally split with 53% indicating they identified with Flipping the Bird and 47% with Black Swift. This phase demonstrated that when an individual wine drinker identifies with the visual sensory cues on a label, there is a cross-modal association between senses that impacts the actual taste of the wine (Figure 2).
Figure 2: Illustration showing how consumer culture theory explains the consumption culture of wine and how the label impacts the taste of wine.
Phase 5: In-Depth Semi-Structured Interviews
Thematic analysis of the interviews show that respondents recognize that the breadth of options available and relating to the label influences their buying behaviour:
“I don’t know. I guess I have to relate to it on a personal level and I think it’s attractive. I’m just looking at my counter now and I have a French wine from France and its label has a pig on it and it’s called Wild Pig. And I don’t really know anything about wild pigs or France or anything like that, but I really liked the picture of the pig and that’s why I bought this bottle of wine.” (Respondent #10).
It is clear that those interviewed choose wine that is a reflection of their own identity (Bauman, 1992; Beck & Ritter, 1992), as predicted within the culture of consumption theoretical framework of this research:
“Ultimately, because it’s the same kind of things that I like in general, not just when it comes down to wine. When you look at the things that I’ve hung in my house, they tend to be very pop art and have the same characteristics that I described to you about what I was looking for in a wine. It’s not specific to wine, it’s just my preference about life and now it’s my preferences for wine.” (Respondent #8)
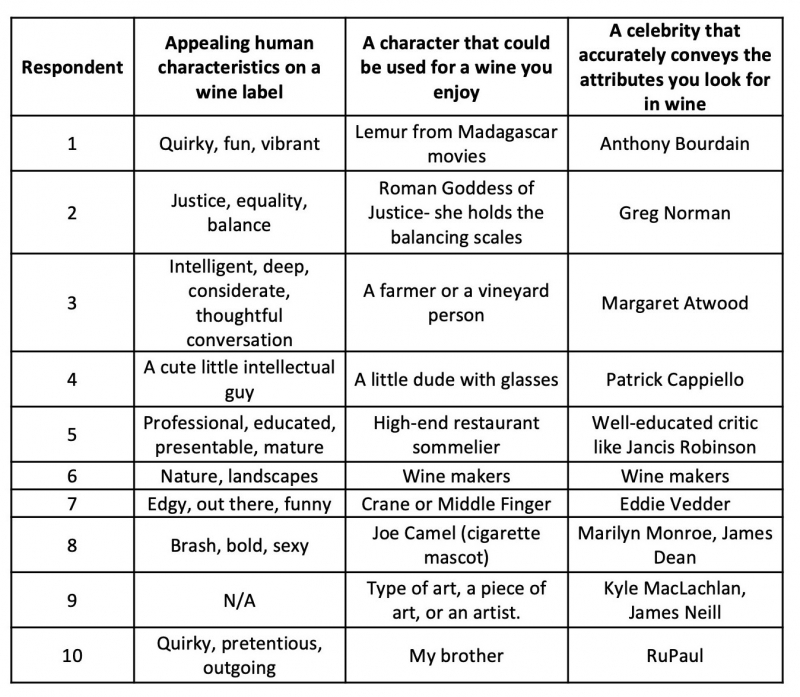
As part of the discussion, each respondent was asked what specific human characteristics they find appealing on a label, what type of character exemplifies those qualities, and what celebrity could effectively endorse a wine they would try (Table 3). The theme that emerged most prominently in this discussion is that respondents chose items that either describe themselves or describe who they aspire to be. A common expression used when discussing the effects of eating food is “you are what you eat”, but in the case of the wine label, it appears that wine drinkers like to drink who they are:
“… if you think about the Madagascar movies … the head lemur guy is eccentric, he is quirky… is fun. He doesn't really seem like he takes himself really seriously and I think the big thing is that people just take themselves and wine a little bit too seriously. (Respondent #1)
“Margaret Atwood, because I think she’s intelligent and thoughtful. I would think she wouldn't tell a lie. If she was going to endorse the drink, she’d probably really mean it.” (Respondent #3)
The connection between a wine drinker and the visual sensory cues on the label are explicit and literal. This research demonstrates that while multiple consumers can find their identity in the same image, the reasons can be very individualistic. With a plethora of options available on the wine shelf, wine drinkers desire to drink who they are by finding a label that is “for someone like me”.
Table 3.
Conclusion
The results of this research use consumption culture to go beyond the impact of the label on purchase intent and appeal, to show how individual experiences drive consumers to find something they personally identify with. Individual consumers use past experiences to seek products they can identify with, to represent who they are and/or the image they want to convey through the cultural meanings they associate with their consumption30. Through five phases of research, the results of this research demonstrate that when visual sensory cues on the wine label represent a wine drinker’s identity, a cross-modal association may bias the actual taste of the wine. Therefore, the label does impact the taste of the wine as consumers seek to “drink what you are”.


