
INTRODUCTION
Grapevine cultivation in Italy can be traced back to ancient times and covered the entire peninsula adapting to a very large number of environmental conditions. Currently, compared to pre-phylloxera age, the number of cultivated varieties has certainly reduced, but still remains substantial. In fact, in the National Register of vine varieties 472 grape varieties for wine production and 129 for table grapes are recorded.
The purpose of this paper is to analyze briefly the main changes in the cultivation of vine in the period 1970 - 2010, on the grounds of official data of the decennial censuses made by ISTAT (National Institute of Statistics). In the first part data will be provided on the progress of the national and regional acreages devoted to vine for table and wine production. Due to the fact that production of table varieties is less important in comparison to wine varieties and that the table varieties grown are the more and more foreign varieties that change quickly, in the second part we will analyze the main patterns of national acreage in respect to vine varieties for wine production only.
THE NATIONAL AND REGIONAL VINEYARDS.
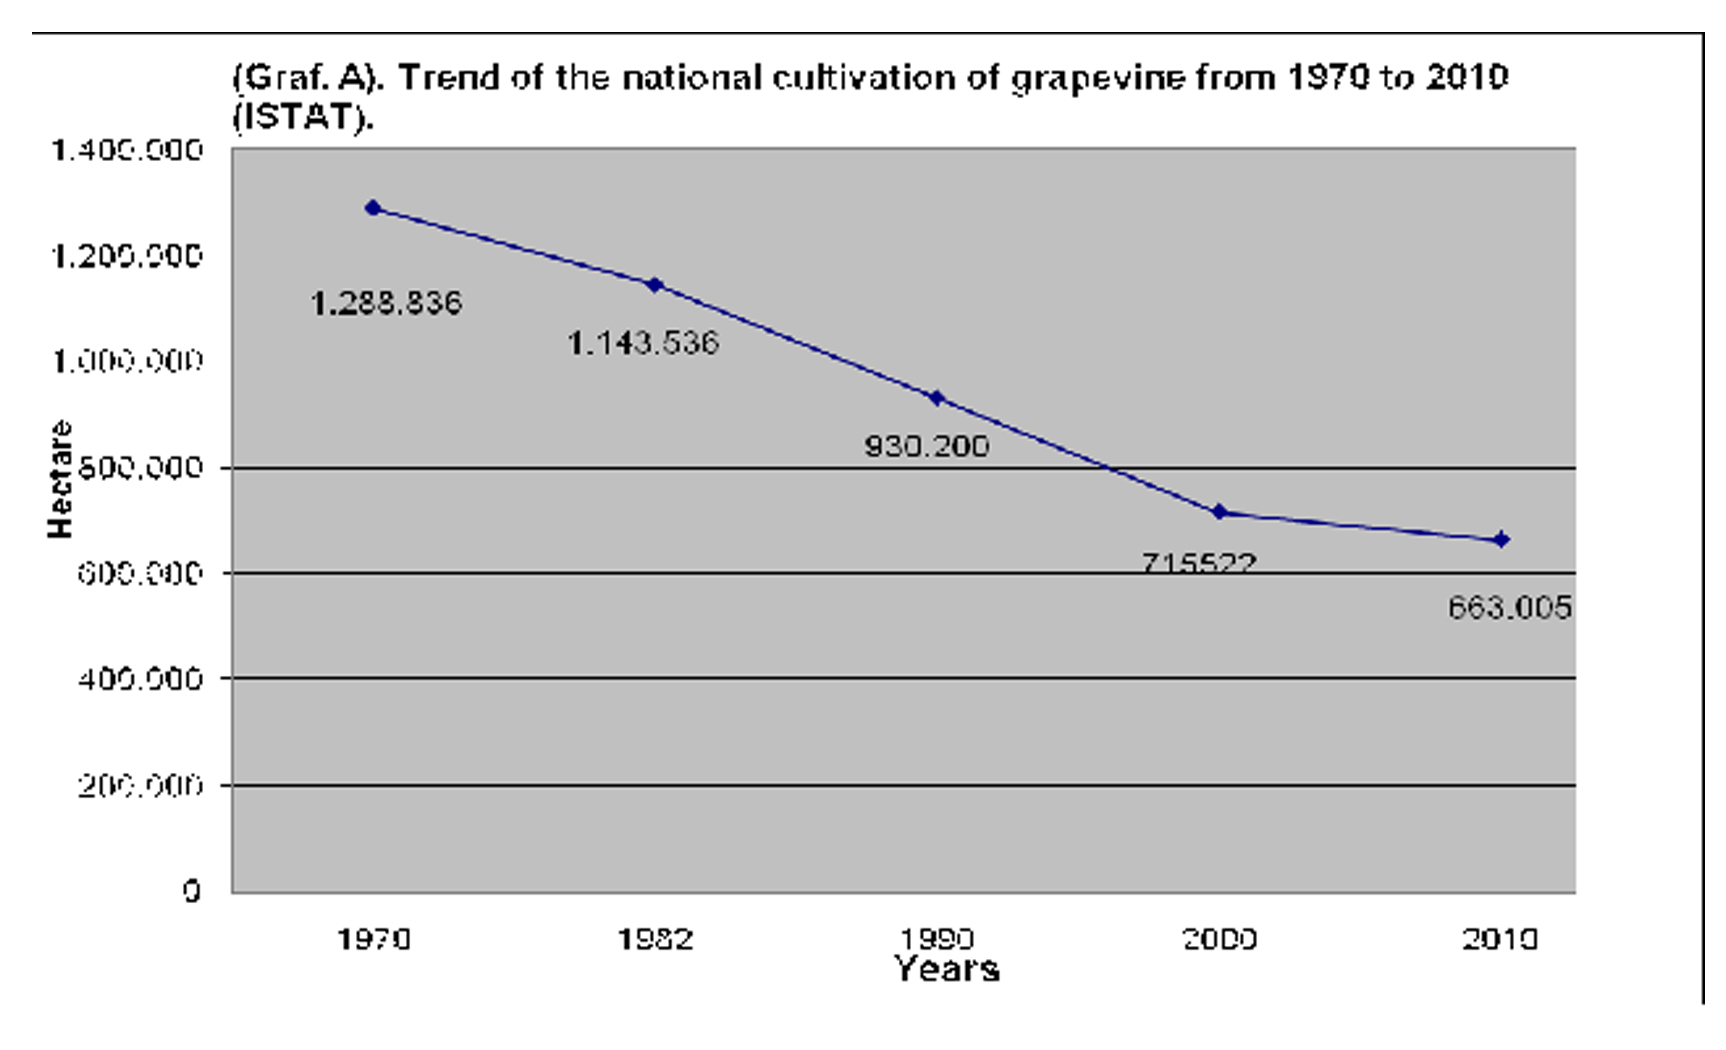
Since the early '70s, the areas under vines have had a negative trend with a sharp decline to the present day. In fact, the over 1.288.836 hectares (wine and table varieties) surveyed by ISTAT in 1970 shifted to 663.005 in 2010, a decrease of 625.831 hectares equal to 50% of the initial vine growing area. This decline has been continuous and had a higher incidence in the 70-82 decade, with the loss of about 145.300 hectares, and then in 1990-2000 decade with other 214.678 hectares that were withdrawn from the production area. The phenomenon has continued according to the last ISTAT (2000-2010) survey, but with a little slower trend, to the point that in this period only 50.000 hectares of vineyard area were lost; that is an annual quota of about 5.000 hectares, compared with more than 20.000 of the previous decade and 15.000 in the period 70-82 (Graph. A and Table 1).

Tab. 1 Trend of regional areas under vine from 1970 to 2010 (ISTAT).
The reasons of this reduction, which interested the whole country, are due to many factors, such as: a) the type of economic development, where the incidence of the agricultural sector on the entire economy, from the 60s, has been gradually decreasing in respect to industry and services sectors; b) the specialization of farms whose productions have been increasingly market-oriented; c) the wine policies, at European and national level, that first encouraged the abandon of areas under vines and later promoted the conversion and renovation of existing vineyards; d)the evolution of consumer tastes that are increasingly oriented to the use of neutral and less alcoholic drinks which have certainly given a blow to consume of wine, which in turn is passed from over 100 liters. per capita of the ‘60 to 40 liters of today.
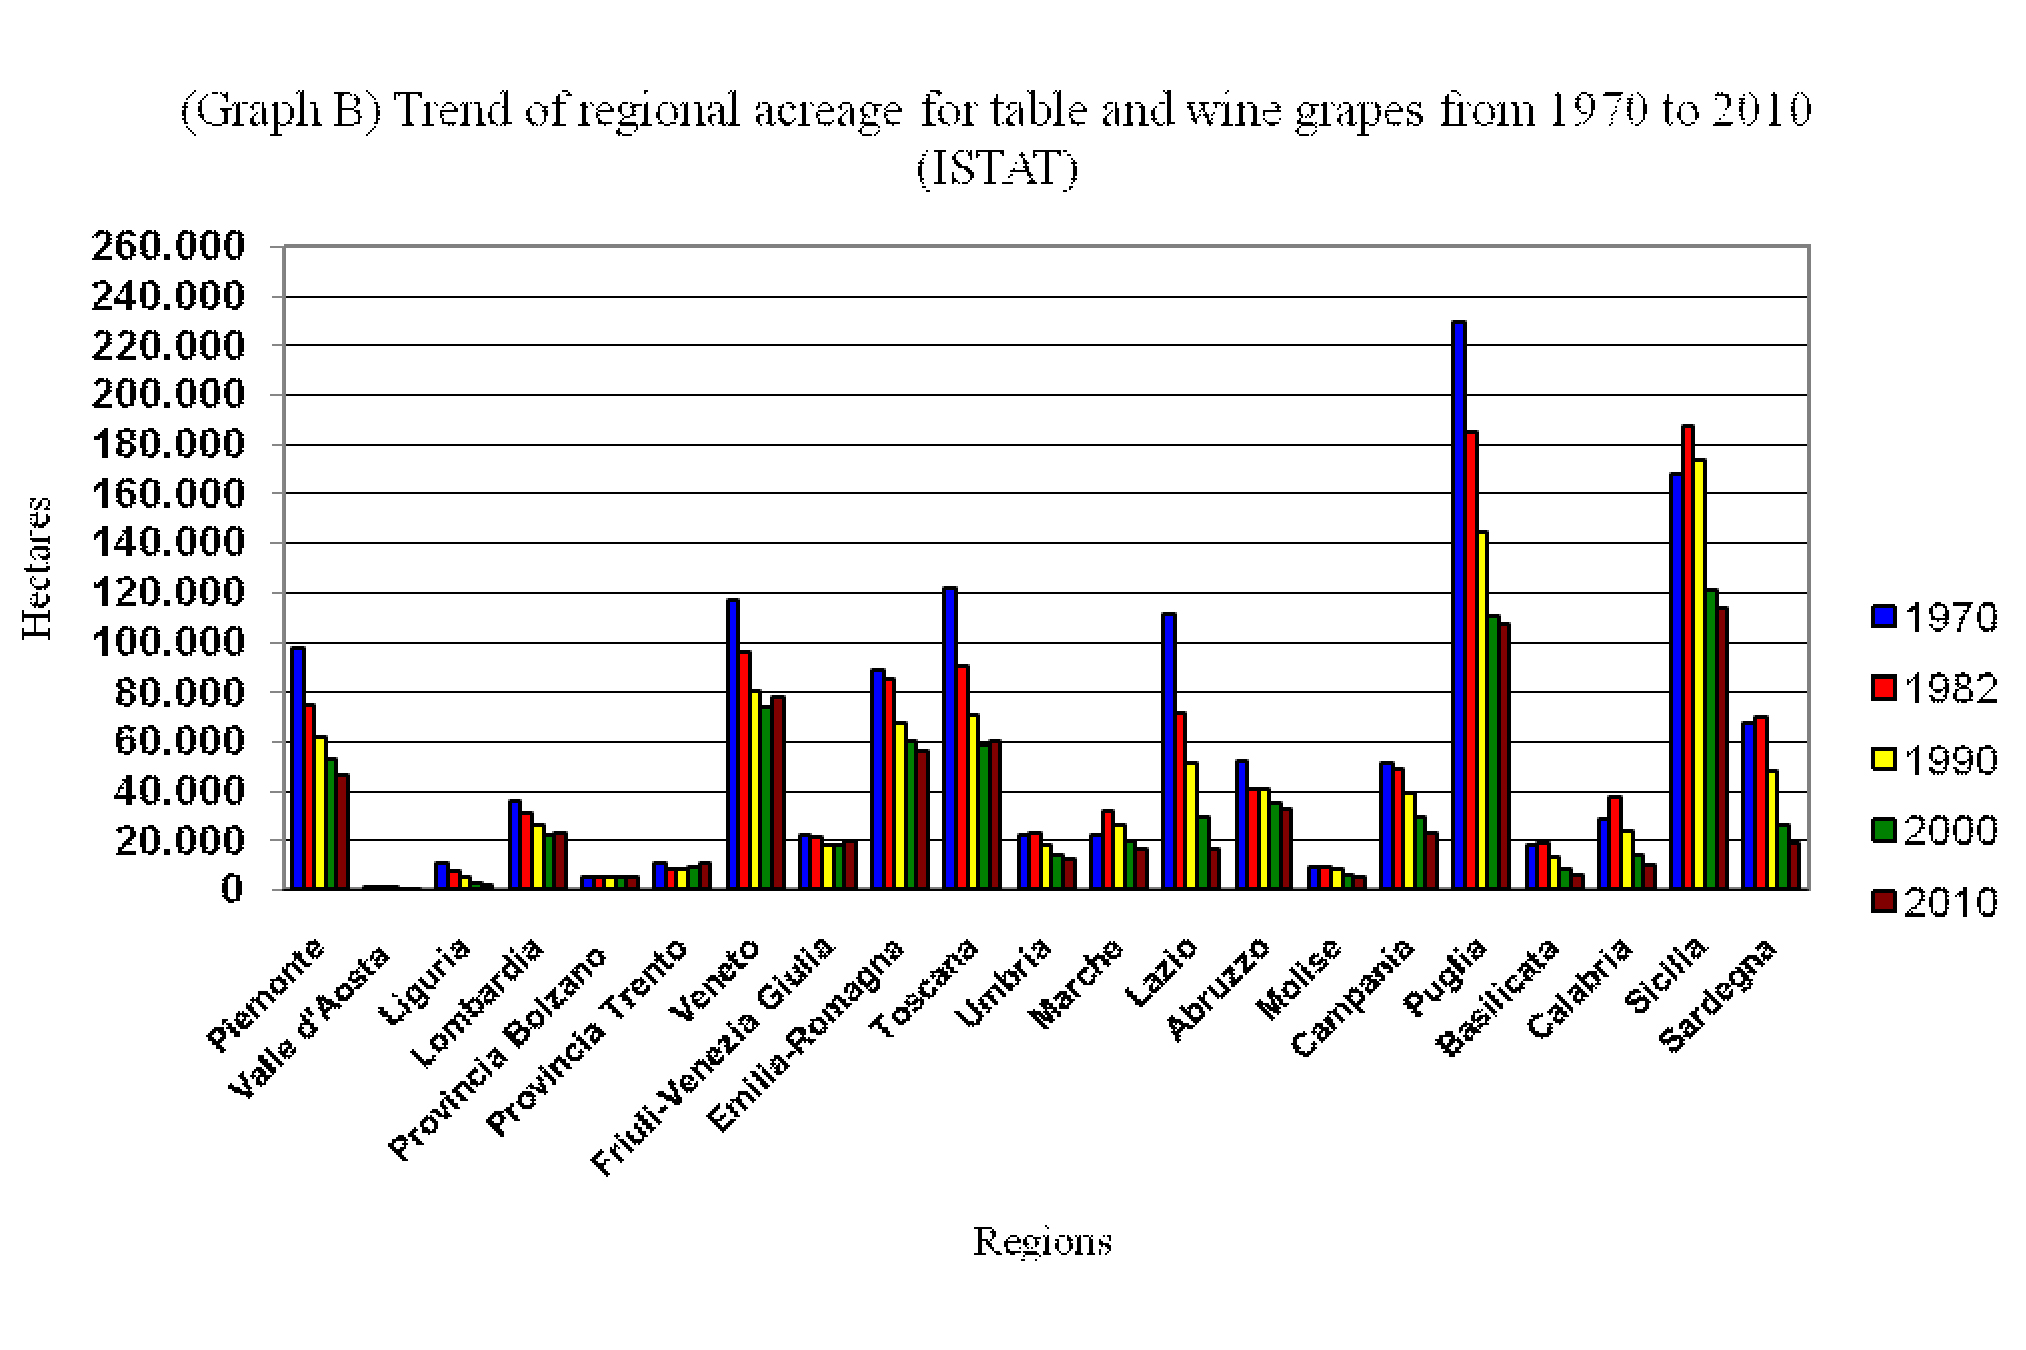
Continuing the analysis on the pattern of areas under vines in the last decade, but on a regional basis (Graph. B), we note that, especially in some regions, this has taken different and extremely positive trends in terms of increase in wine-growing areas such as the Veneto, Friuli V.G., Toscana, Lombardia and of the Provinces of Trento and Bolzano. In all other cases, the regional area planted to vineyard has been affected by a steady decline, although there were also available for these Regions incentives for preventing the abandon of wine-growing areas and to upgrade and enhance the wine production .
Likely the Regions mentioned above, where the wine industry was already growing due to increased demand for the products of those areas, have been able to take advantage of these measures especially in the last decade (Graph. C), and this has helped to accelerate and in some cases strengthen their supply curve. An example of this is the increase in the areas planted with the varieties Pinot Grigio and Glera in Veneto and Friuli Regions.
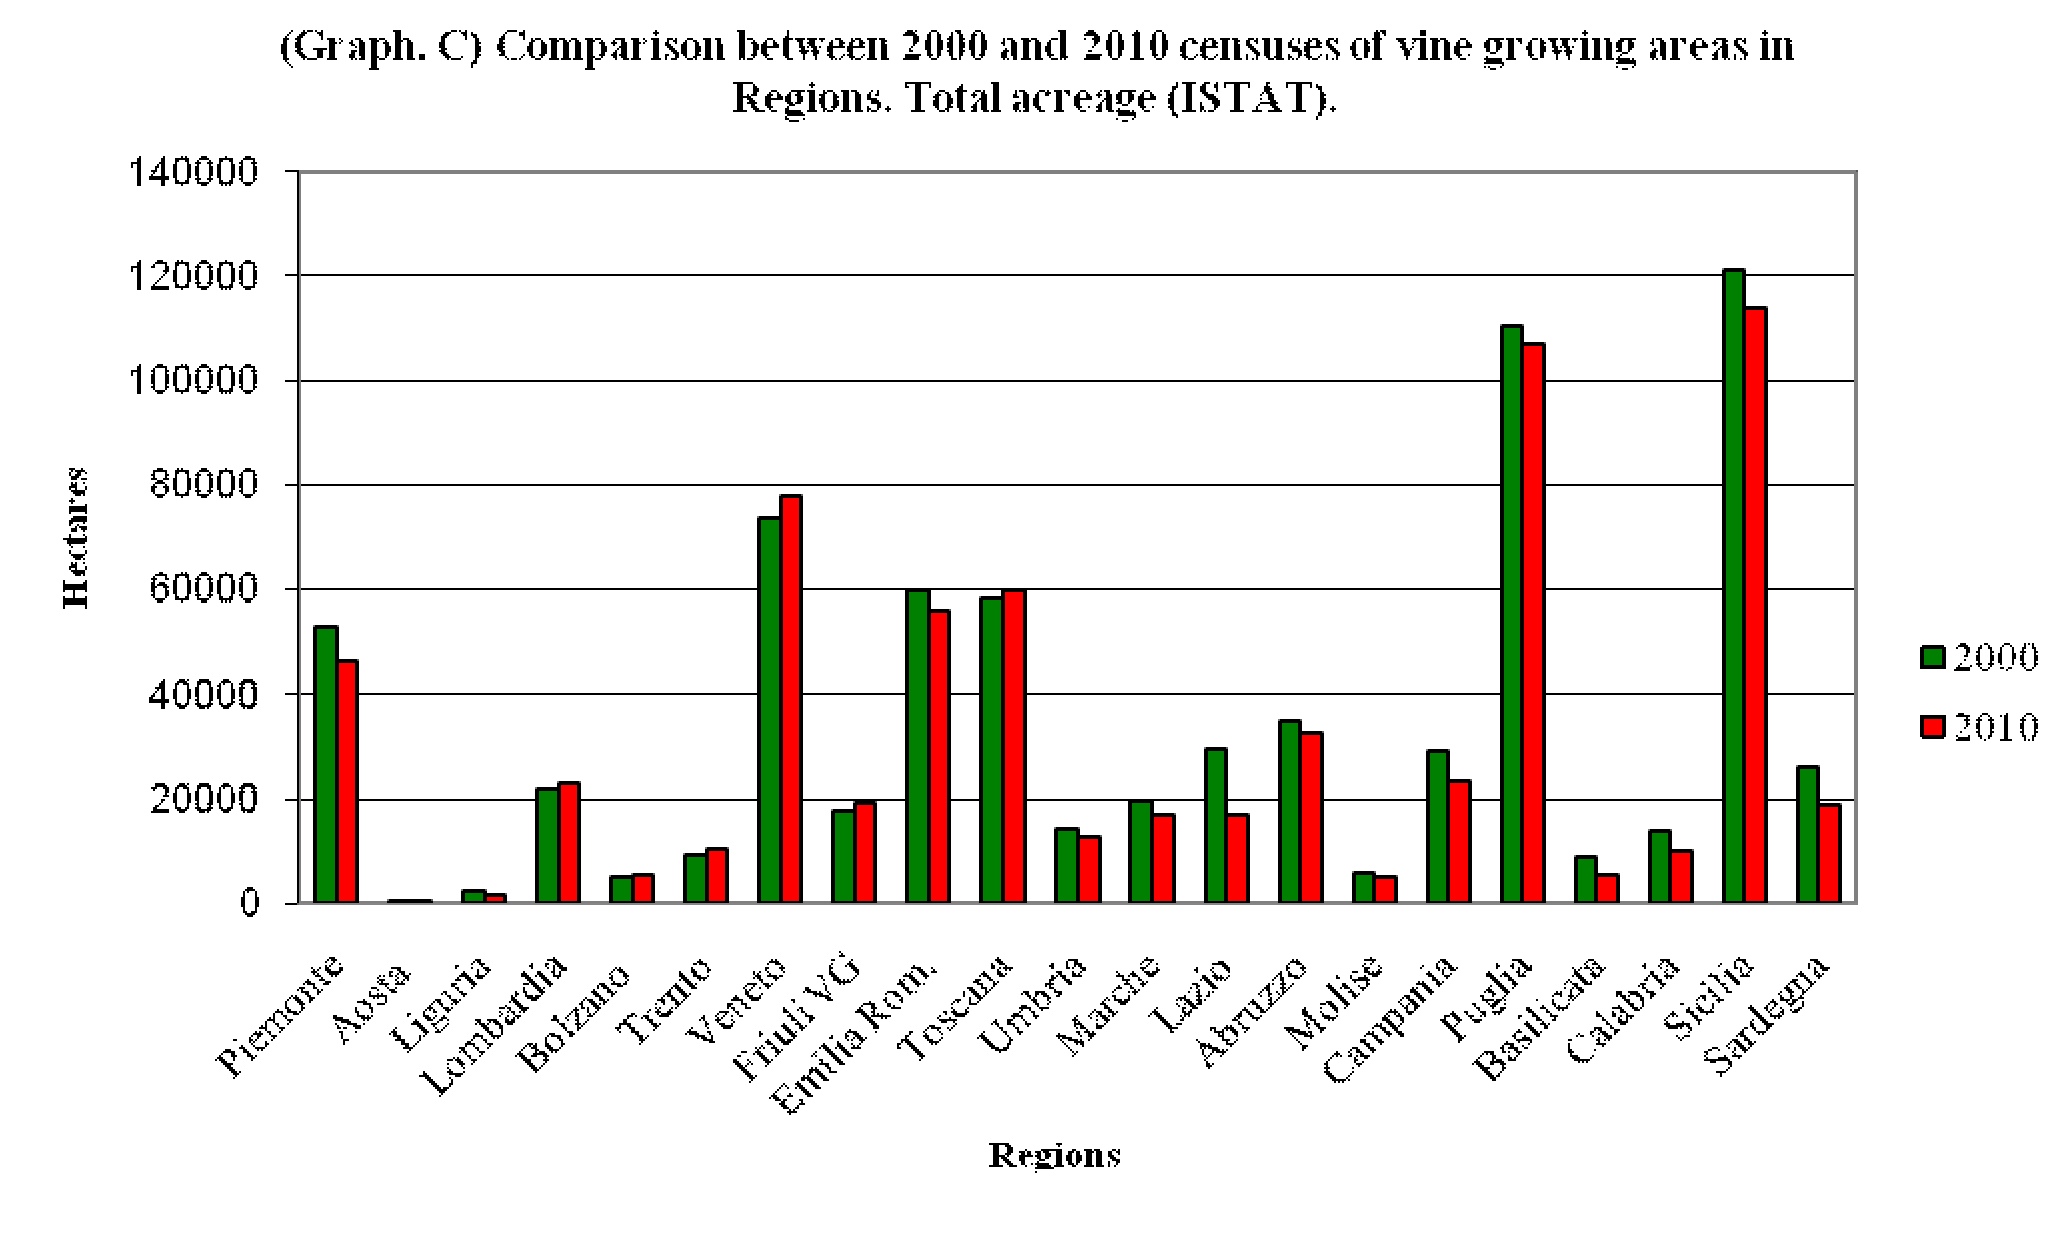
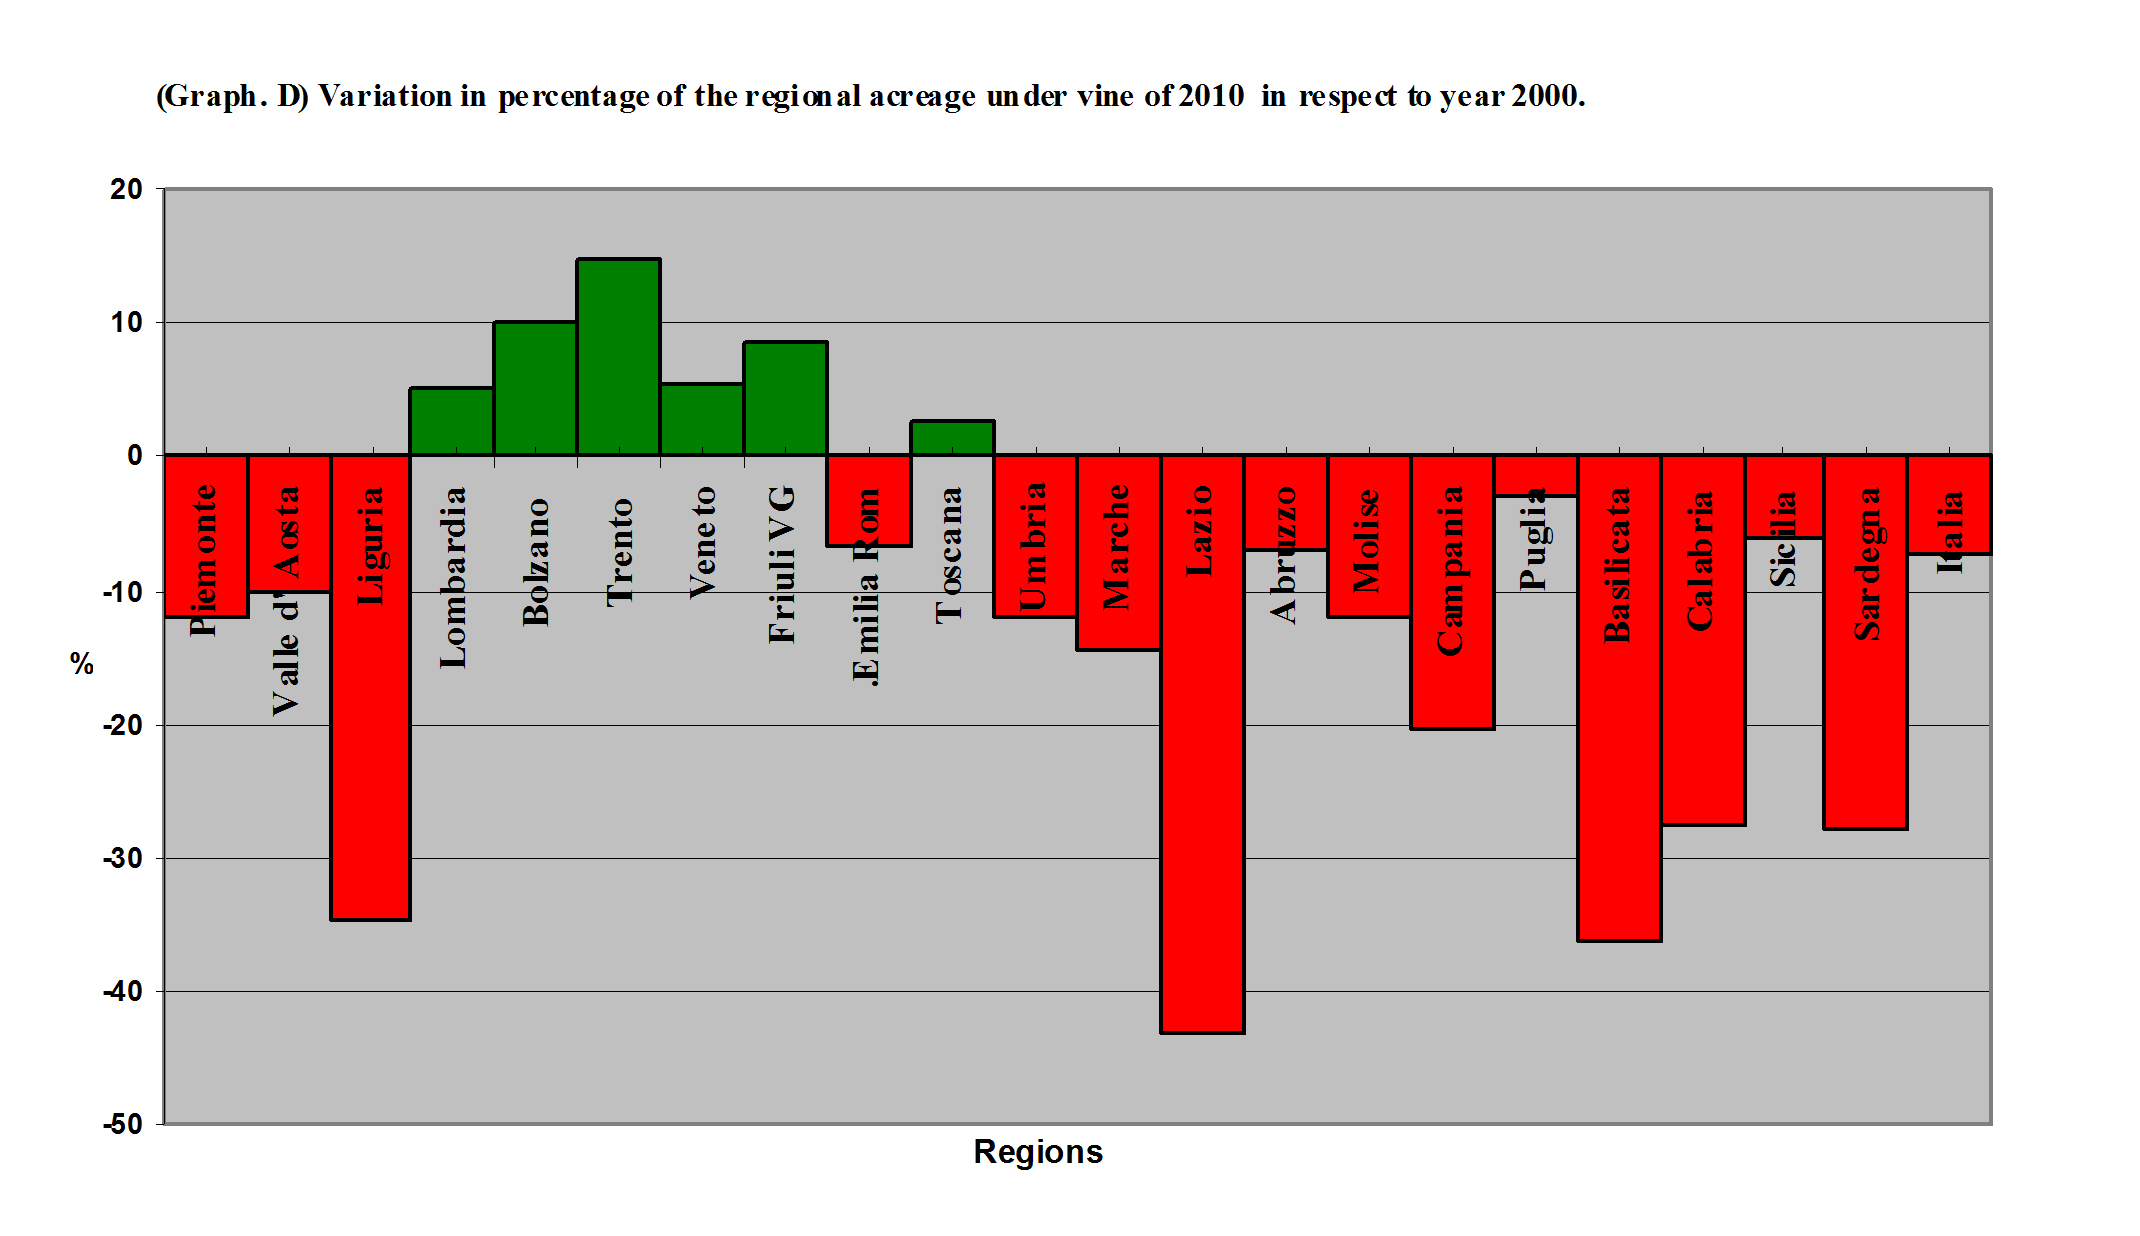
Graph C. shows the areas under vine in 2000 and in 2010. It makes clear what earlier stated and how this increase in surface has interested primarily a well-defined wine-growing area of the Country, which includes more Regions that are almost homogeneous by climatic conditions and dedicated to the cultivation of vine varieties that give a '"footprint" very significant to their wines. By contrast, in areas where occurred a sharp decline, which continued, albeit in a more subdued way even in the last decade, the autochthonous varieties have been an opportunity for a recovery of the cultivation and the same time have contributed to help preventing the erosion of the wine growing area (Graph. D).
On such basis, one can easily deduce that the loss of potential production that has affected our country, and which will be later explained in more detail, is not necessarily the same in all varieties. In fact reduction of the size of some of them is in line with the general decline registered for the country. This is the case of Trebbiano romagnolo, Trebbiano toscano, Malvasia bianca di Candia , etc. Other varieties, however, show a sharp increase such as Glera and Pinot grigio; others a consolidation associated with a slight but continuous growth. This is what happens with some autochthonous varieties such as Aglianico, Pecorino, Fiano, Falanghina etc.
While Italy has seen over the last 50 years a steady erosion of areas under vines reaching in 2010 about 663.005 hectares, is also very interesting to wonder if the current acreage can be deemed to be balanced with the marketing of wine even if over the past decade it has been subject to an average annual decrease of approximately 5.000 hectares that in percentages corresponds to slightly less than 10 % of the total acreage. Most likely, given the nature of wine market and complexity of exchanges that take place on a global scale , the national vineyard, can be considered balanced for the simple reason that now the growers are specialized and have all the tools to cope with the changes of market in a relatively short time. A major obstacle that is, paradoxically, a limitation to the adaptation of production structures to the needs of the market, is represented by the EU wine policy that imposes very severe constraints on the establishment of new vineyards, with consequences that heavily condition not only the growth and diversification of global supply but also its flexibility in response to changes in the demand for the relevant wine products.
The graph E shows the varieties that between 2000 and 2010 increased and decreased more than 3.000 hectares. It 's interesting to note that in respect to 2000 census, the increase in the total area of the 10 varieties that have increased their acreage accounts for 63.807 hectares, while it amounts to 66.835 hectares for those 10 for which the cultivated area is reducing; in practice nearly the same figure.

THE ACREAGE FOR THE PRODUCTION OF PDO WINE
Italy is one of the leading wine producing countries in the world and every year it compete with France for the first place.
The production of wines with a designation of origin, however, is steadily increasing and, to date, it accounts for 73 Denomination of Controlled and Guaranteed Origin (DOCG) wines, 336 Denomination of Origin (DOC) while IGT (Typical Geographical Indication) wines are 118.
Italian traditional terms DOCG and DOC correspond to EU PDO (Protected Denomination of Origin) term, and IGT to PGI (Protected Geographical Indication) term also envisaged by EU regulations.
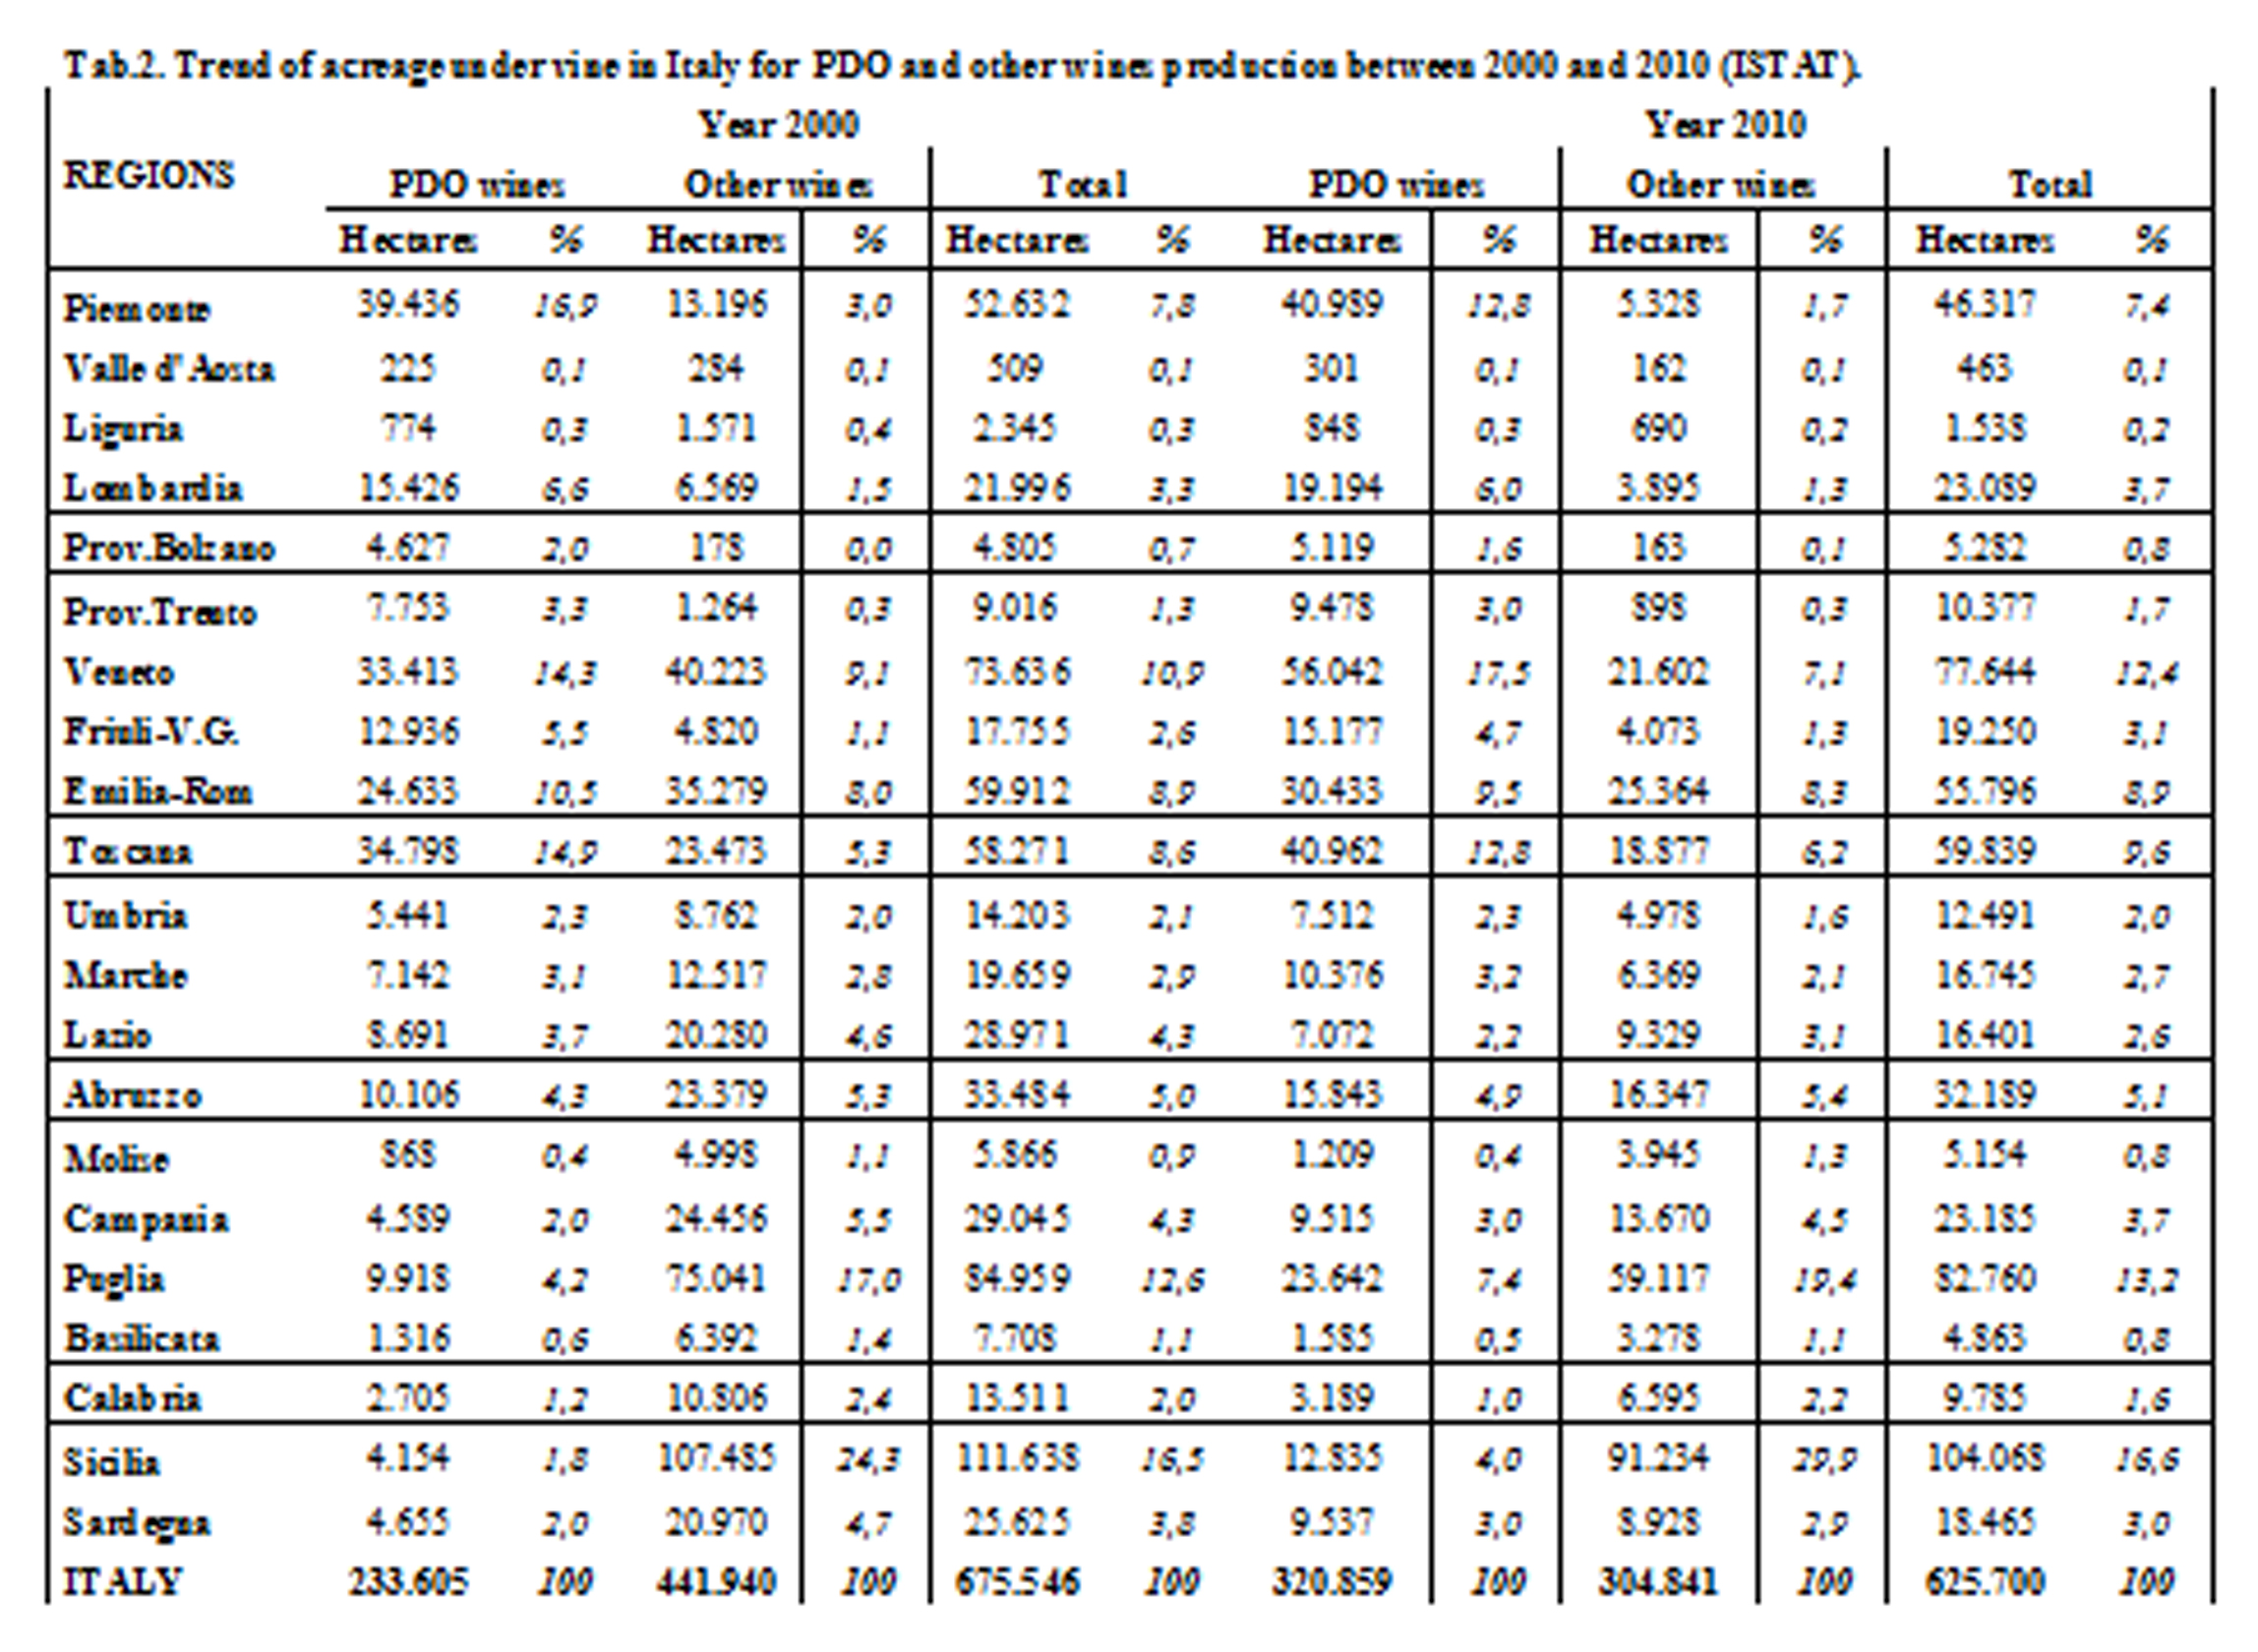
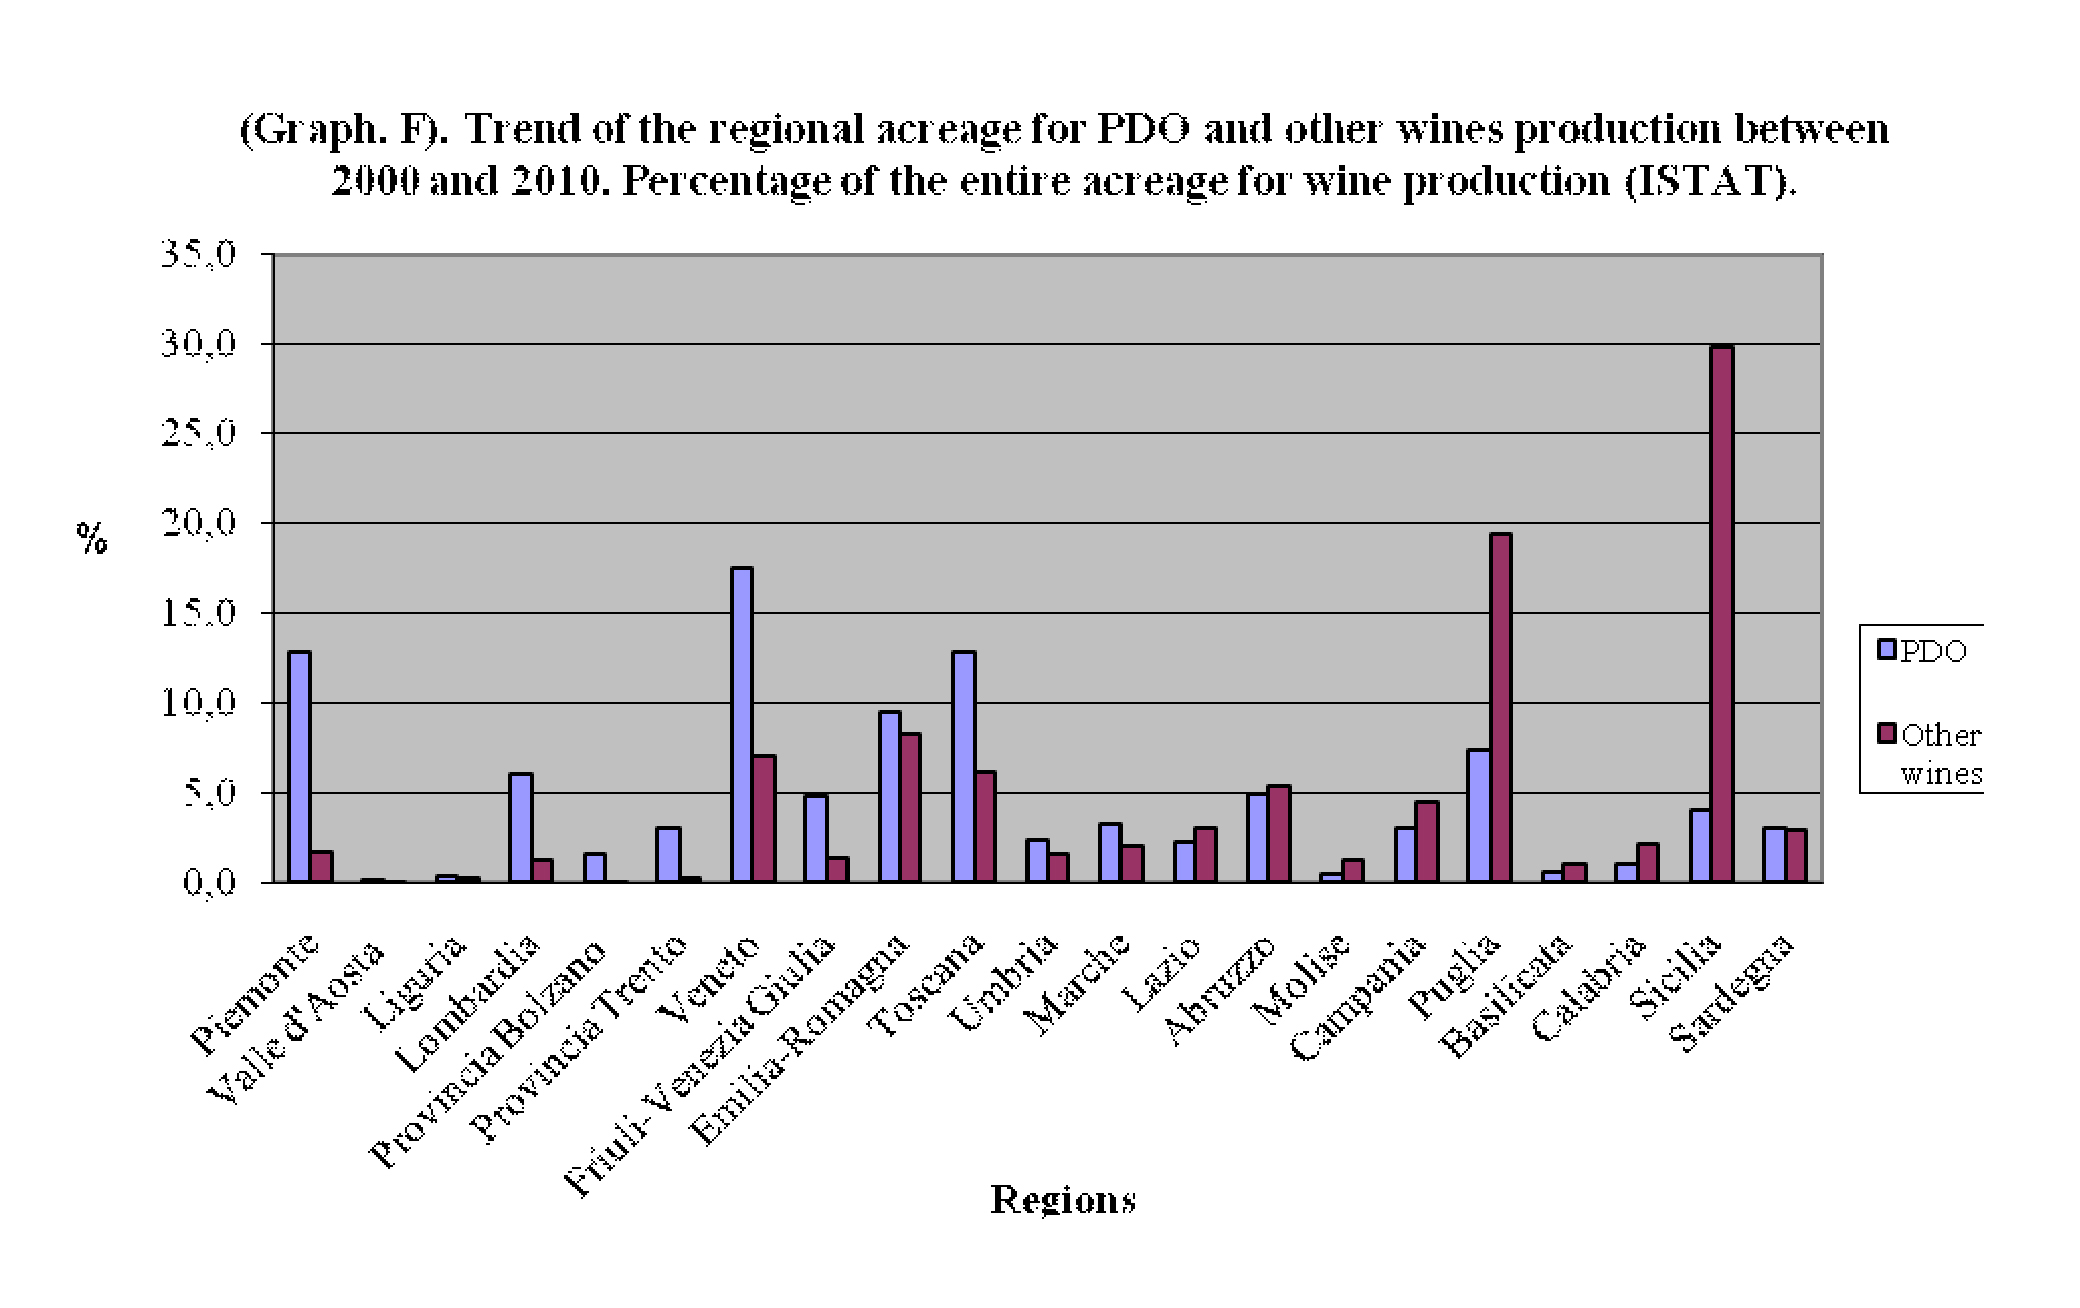
Comparing to 2000, the Controlled and Guaranteed Designations of Origin increased by almost three times, the Controlled Designations of Origin by 25% and the Typical Geographical Indications by 15%. The latter, while representing production of high quality that can be compared, in some respects, to the ones of the other two categories, if only for their origin and the close link with the territory, account for a significant share of Italian wine-growing area and contribute significantly to its qualification. For the purposes of the official statistics, however, so far, this category of products is included in the group of "other wines", as shown in Table 2 and Graph F below.
Analyzing the trend of the acreage in relation to the different kinds of wines, it appears (Table 2) that there has been a significant increase in the qualification of wine production and the surface for the production of wines with Controlled Designation of Origin moved by under 35 % in 2000 to 51 % in 2010. And this demonstrates the sensibility that growers and wine makers have had to react to the spurs coming from the market and to technological innovations, with the transformation and upgrading of the productions that have affected our winemaking sector in the last two decades.
Going more in depth, we note that, as absolute value, the hectares of vineyards intended for qualified productions increased by 37% from 233.605 in 2000 to 320.859 in 2010, that is an increase of 87.254 hectares. It is a very important result particularly if it is compared to other types of wines whose surfaces have, however, suffered a decline in the same decade of 42 %, that is 137.099 hectares. The latter figure also includes 50.000 hectares lost with the general contraction of the wine-growing area, but it clearly shows and confirms the dynamics of production that are increasingly oriented towards the wines of high quality.
As to the geographical concentration of production with Controlled Designation of Origin, the highest score is northern and central Italy (73% of the total area), while in the southern Italy, between 2000 and 2010 it was registered the greatest percentage of increase that for some designations has doubled (Table 3 ). The phenomenon can be explained by gap existing, since the second half of the last century, between viticulture and oenology of the two areas which still now have very different socio-economic and structural characteristics .
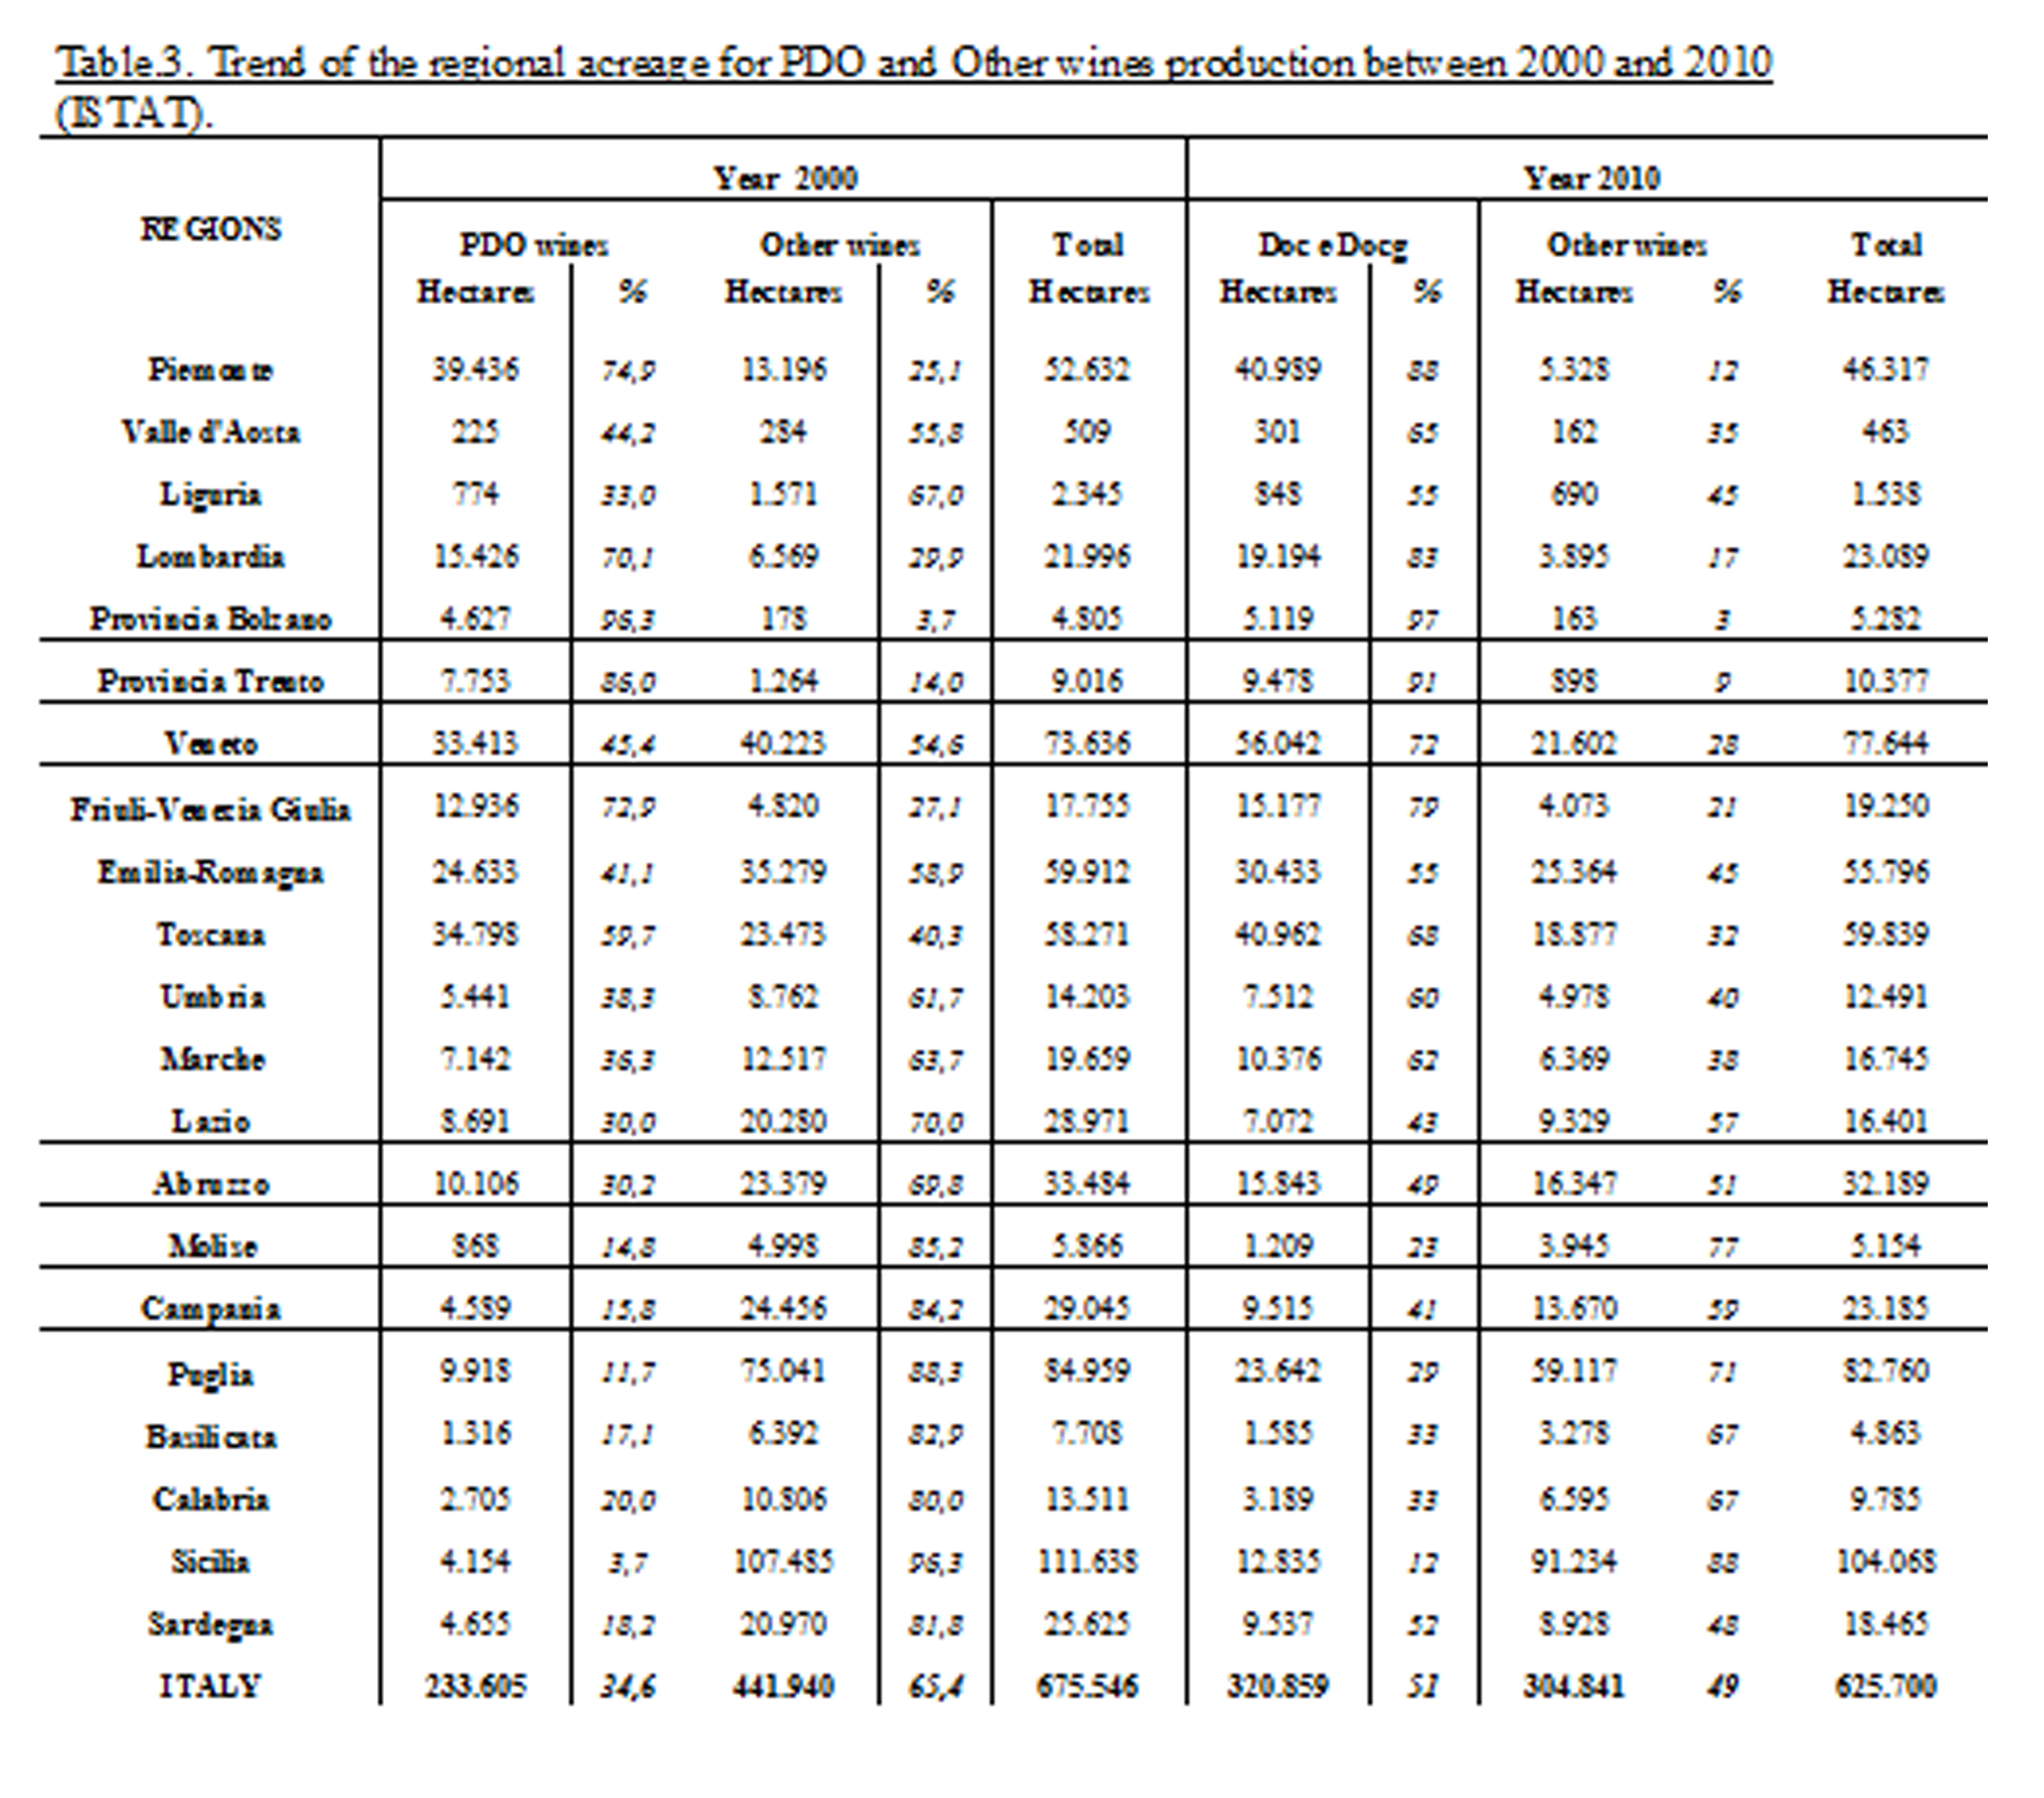
Table.3. Trend of the regional acreage for PDO and Other wines production between 2000 and 2010 (ISTAT).
At the level of regions , it can be seen that in over half of these (12 regions and 2 autonomous provinces ) the percentage of qualified vineyards swings between 97% and 52% of their total surface, while in 7 other regions this percentage is between 30 and 50%. Only in Sicily, this percentage is low and reaches 12%. But if we think that such percentage is equal to 12.835 hectares, we note that even in this region there was an important and significant increase of the qualified vineyards. Such surface will be set to increase over the years, given the remarkable consistency of the wine-growing area of this region.
A large number of varieties, both autochthonous and international, that can bring forth the best of their characteristics thanks to the peninsular territory which provides a different type of soil and climate environments, contribute to the production of this rich category of quality wines.
THE EVOLUTION OF ACREAGE GROWN WITH WINE PRODUCING VARIETIES
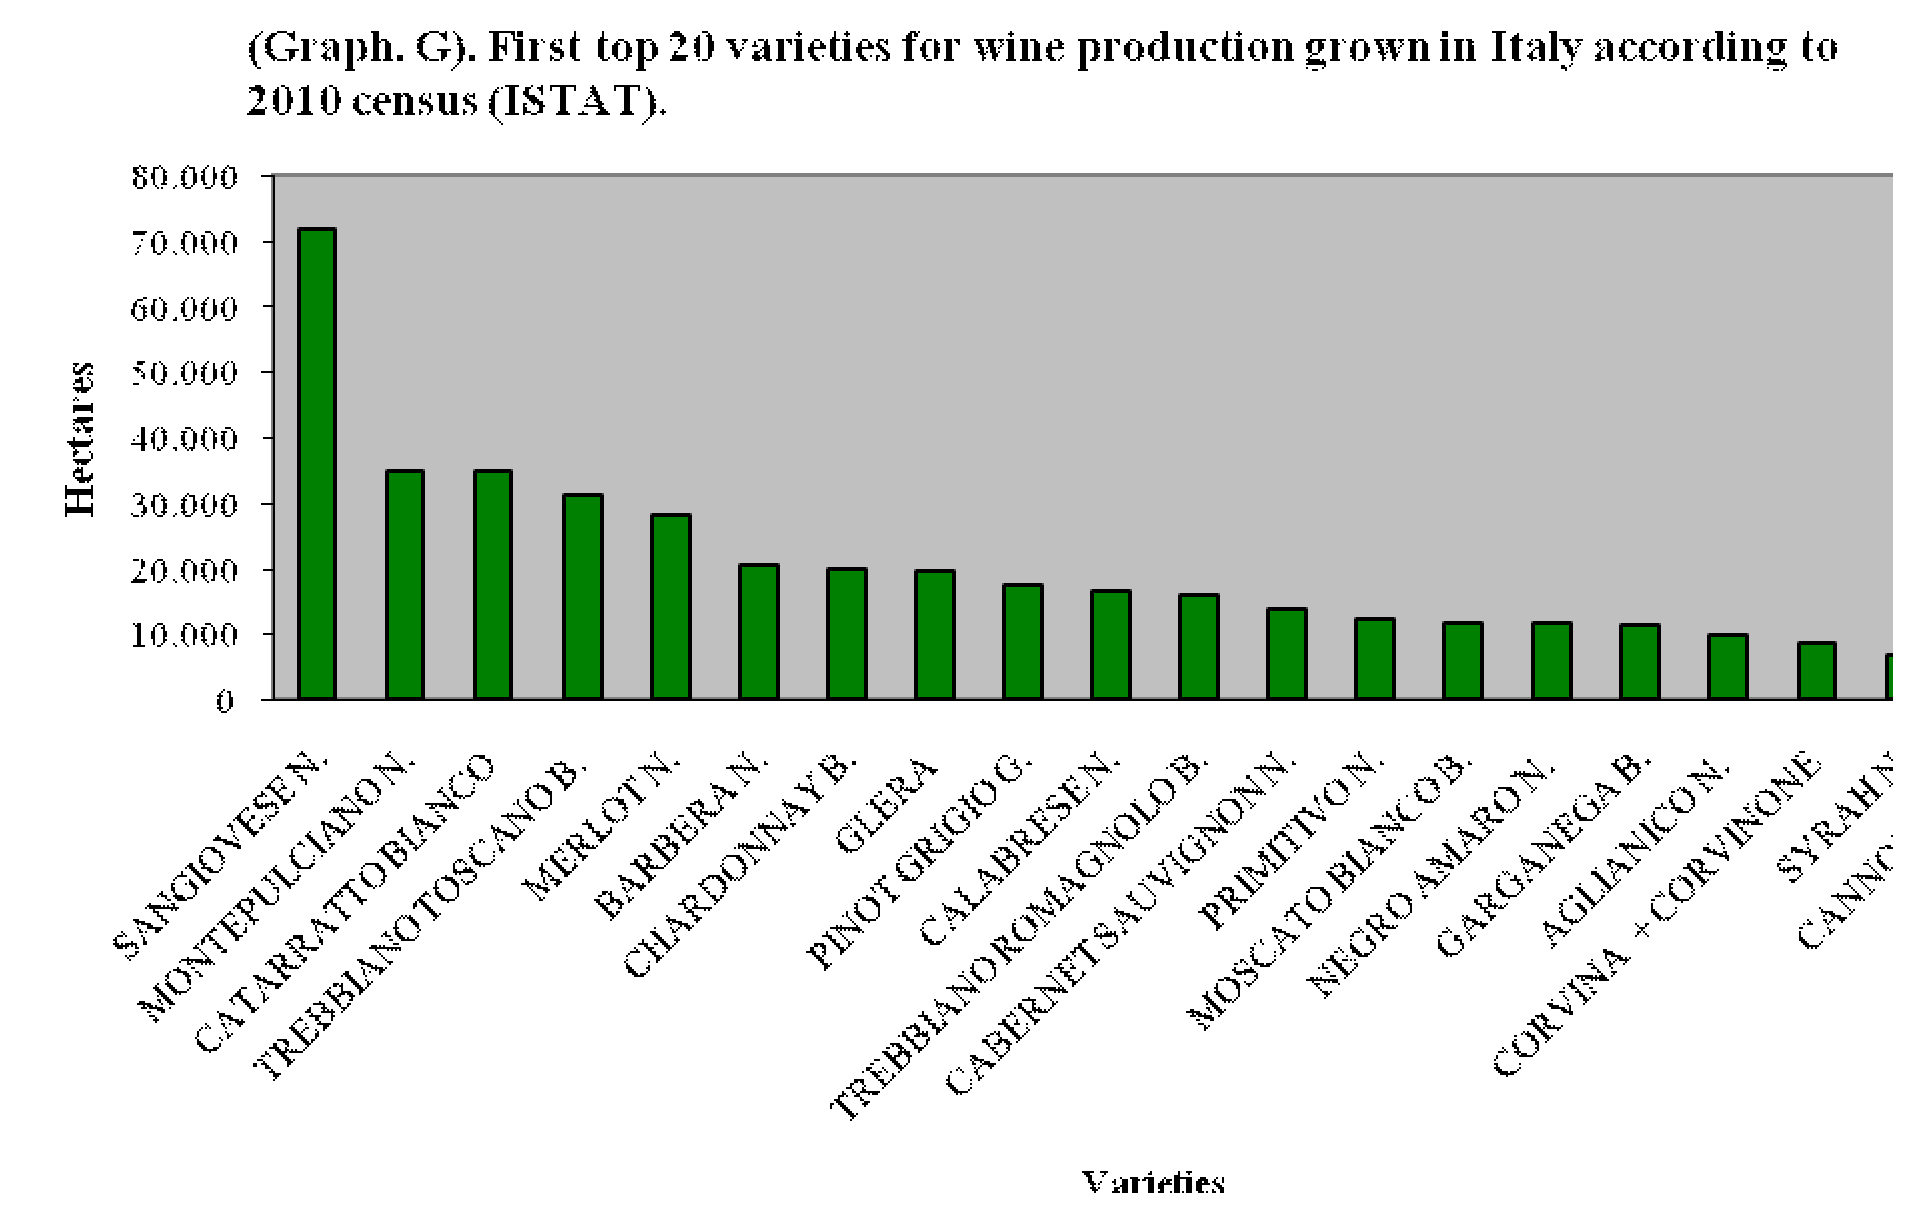
The wine grape varieties currently more grown are presented in graph G, while table 4 shows the trend of the top 20 varieties since 1970.
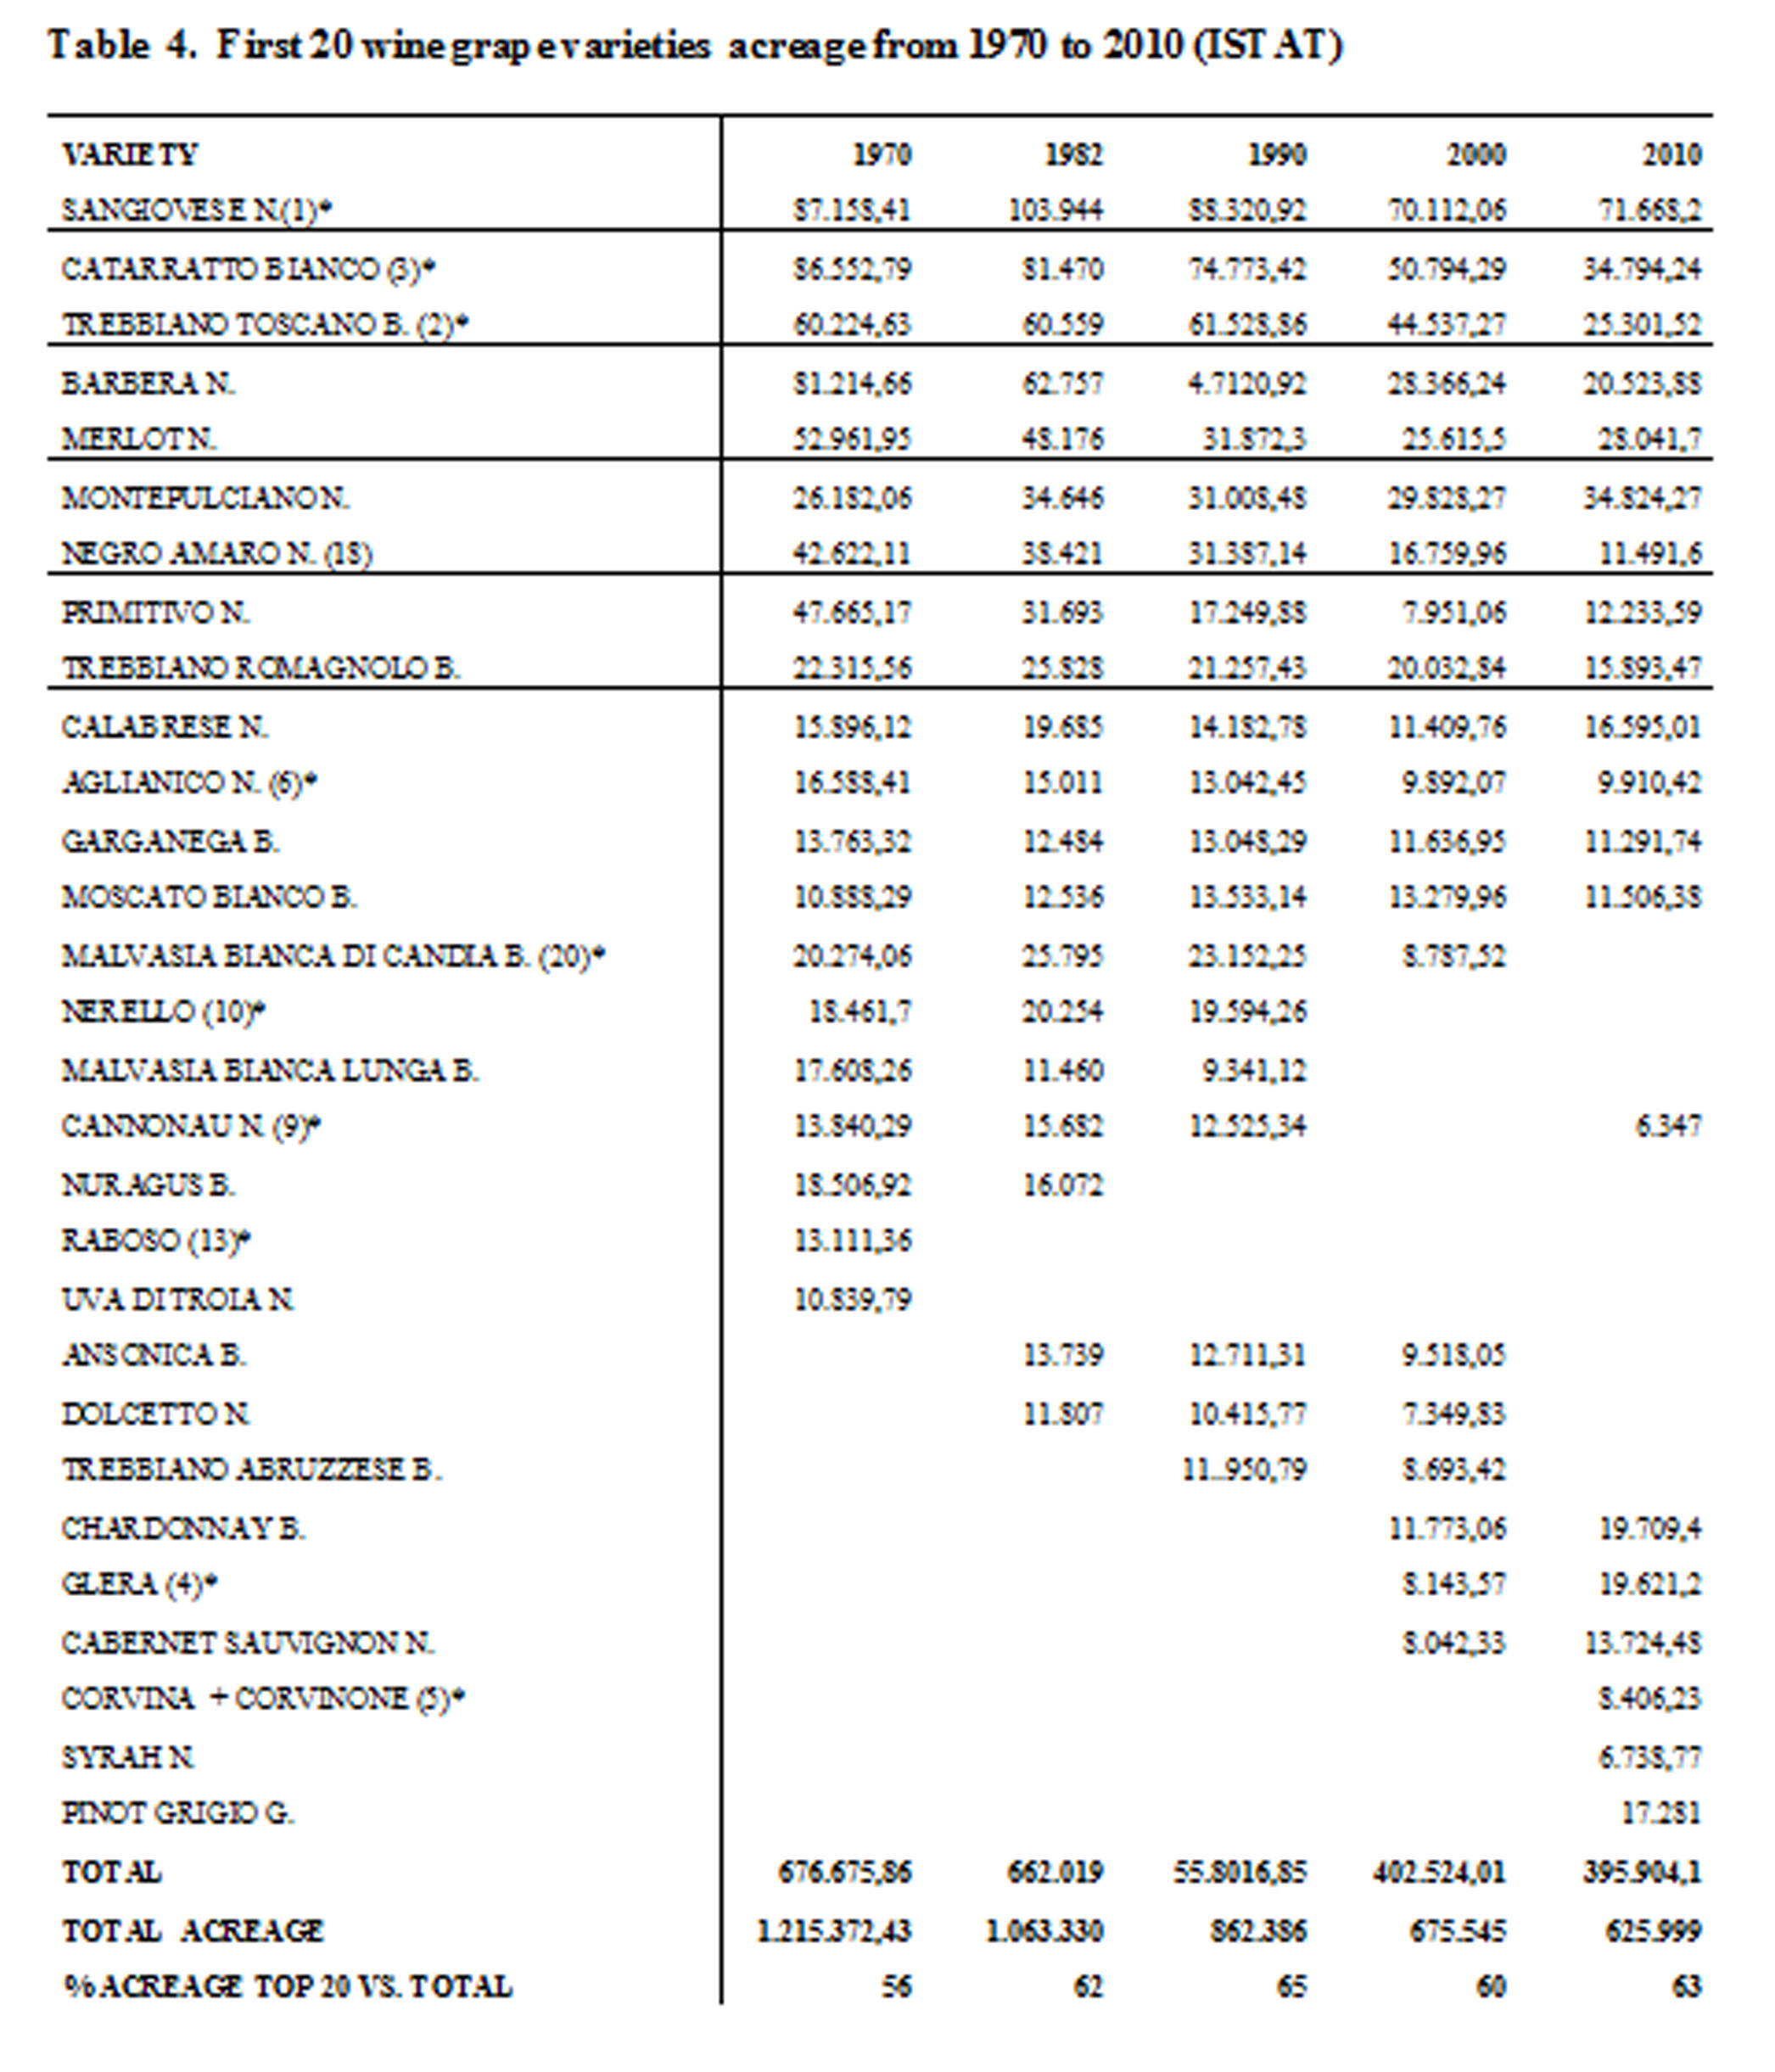
* See footnotes under table 5.
These varieties account for over half the national vineyard. Moving from 1970 to 2010 the area planted with these varieties increased 56 to 64 % compared to the total area devoted to wine grapes. Logically the list includes 29 varieties as some them that were among the most cultivated in the early decades, later went down in the rankings, while others in the more recent decades are among the top twenty.
There is, however, a core of 13 varieties that fall into this group in all 5 censuses: Sangiovese, Trebbiano toscano, Catarratto (bianco e lucido) , Barbera, Merlot, Montepulciano , Negro amaro, Trebbiano romagnolo , Primitivo, Aglianico, Garganega, Calabrese and Moscato. Among these 13 varieties, only Merlot is an international variety, the others are autochthonous varieties spread across many regions (Sangiovese, Trebbiano toscano, Moscato, Montepulciano) or localized mainly in certain quality wine-growing areas: Sicily ( Catarratti and Calabrese), Piedmont (Barbera) Puglia (Primitivo and Negroamaro), Basilicata (Aglianico), Garganega (Veneto) and Trebbiano romagnolo (Emilia Romagna).
For all these varieties, there is a trend towards reduction since 1970 in line with the general reduction of the acreage under vine. Some of them, however , Sangiovese, Merlot, Montepulciano, Primitivo and Aglianico show a reversal of this trend in the period 2000-10, that is an increase in the area planted. The area planted with the variety Garganega is essentially stable since 1982.
Sangiovese steadily, from 1970 to 2010, accounts for about 10% of the national vineyard confirming its supremacy due to the wide geographical spread. Trebbiano , Barbera and Catarratti, however grown on large extent, continue to lose ground especially against more quality effective varieties. Some of the remaining top varieties showed a steady reduction: Malvasia Bianca di Candia , Malvasia bianca lunga, Dolcetto, Nerello. Others appear only in 1970 among the top 20: Uva di Troia, Raboso (Piave and Verona ). Nuragus, variety grown in Sardegna, is recorded just in the censuses of 1970 and 1982; while Cannonau (together with the synonims Alicante and Tocai rosso) is spread in Sardegna and other Regions is recovering in 2010 after a decline between 1970 and 1982. Ansonica, Dolcetto and Trebbiano abruzzese appear, as losing ground, among the top 20 between 1982 and 2000. Also interesting are the data on the varieties listed among the top 20 just in the last or the last two decades. Such varieties are expanding. Calabrese, expanding since 1990, shows between 2000 and 2010 an increase in acreage of 45% Chardonnay, during the same period , an increase of 67%, Cabernet Sauvignon 70%. Finally after 2000, among the top 20 varieties it can be found: Pinot Grigio, Corvina (and Corvinone), Glera and Syrah. Such data confirms the tendency to strengthen the quality viticulture through the expansion of the cultivation of international grapes in areas already structured for the production of quality wines and for export, and the strengthening or expansion of native grape varieties in their areas of origin always for the production of quality wines.
Finally the table 5 shows the data of the wine-growing areas of the first 100 varieties, among the more than 300 under cultivation. These varieties account for 75 (1970 ) to 90% ( 2010) of the viticultural heritage, so highlighting the national trend of viticulture for wine production to the progressive reduction of the number of varieties under cultivation. We move now to some comments on the changes of vineyards of varieties which acreage is lower than that of the group of the top 20 and which expansion or reduction are more dependent on the regional outcome of the viticulture. The data of the 1970 census distinguishes the culture of vine in: “main crop” when the only culture practiced is vine, “mixed main crop” when vine is grown together with other herbaceous or woody crops but is the most important crop on the basis of the value of the annual production and in “secondary crop” when the vine is grown together with other herbaceous or woody crops but is the less important crop on the basis of the value of the annual production. In the present work the data concerning the “secondary crop” are not considered because they refer to small areas (gardens…) grown for personal use. In subsequent censuses the vineyard area is divided into areas for the production of wines with PDO and for the production of other wines.
A group of international varieties which acreage is growing can be emphasized. Pinot Noir has an increasing trend since 1970 mainly in areas with designations of origin. Sauvignon keeps its position with a slight increase between 1990 and 2010. It is grown for 68% in areas for wine with PDO. Similar trend is evident from the Gewürztraminer (Traminer aromatico) steadily expanding since 1970 and mainly in areas with a designation of origin of northeastern Italy. Between 2000 and 2010, nearly triples the area under cultivation. The Viognier variety recently introduced from France is classified in the Regions of Lazio, Piedmont, Sicily, Tuscany, Umbria and under observation in the Province of Bolzano. It is primarily grown for the production of wines without a protected designation of origin.
Then there is a group of local grape varieties that substantially keeps the area cultivated: Nebbiolo with an area of approximately 5.000 hectares. 91% of them for production of Protected Designation of Origin. The same can be said for Lambrusco salamino which acreage is 75% intended for PDO wines.
Ancellotta keeps its positions since 1982 equally divided between wines with Protected denomination of origin and not. Cortese is stable since 1990. Another group of native varieties shows an expansive trend. Lambrusco Maestri, grown in more Regions, after a decline since 1970 is catching surfaces mainly for production of non-designation wines. Grillo, Sicilian grape variety , is expanding since 2000 mainly for the production of non PDO wines. Instead Croatina, Vermentino along with Fiano and Falanghina from Campania, Gaglioppo from Calabria and Lambrusco grasparossa grown in more regions expand mainly in areas for wines with a designation of origin. Also noteworthy is the Pecorino whose surface is even increased tenfold between 2000 and 2010. It is cultivated in Abruzzo ( mainly for non PDO wines) and Marche (usually for PDO wines). The Moscato giallo grape variety is present in many regions. Its surface area has greatly increased between 2000 and 2010. We will see in the next years if the trend continues or if it is just a momentary event.
Sagrantino is also growing steadily since 1970. It has tripled in the last decade its surface and is mainly cultivated in order to produce PDO wines. It is a native grape of Umbria, its main area of cultivation. Similar trend can be seen for Arneis, native grape of Piedmont, in steady expansion since 1970 mainly in areas for PDO wines. There is also a large group of varieties for which there is a reduction in the area of cultivation. Among them Carignano and Rondinella are in steady decline since 1970; Grecanico dorato Sicilian grape, after three decades of growth , decreases from 2000 to 2010.
Among the international grape varieties Cabernet Franc (and Carmenere ) and Pinot Blanc slow down.

Table 5a. More important wine varieties grown in Italy from 1970 to 2010 (ISTAT).
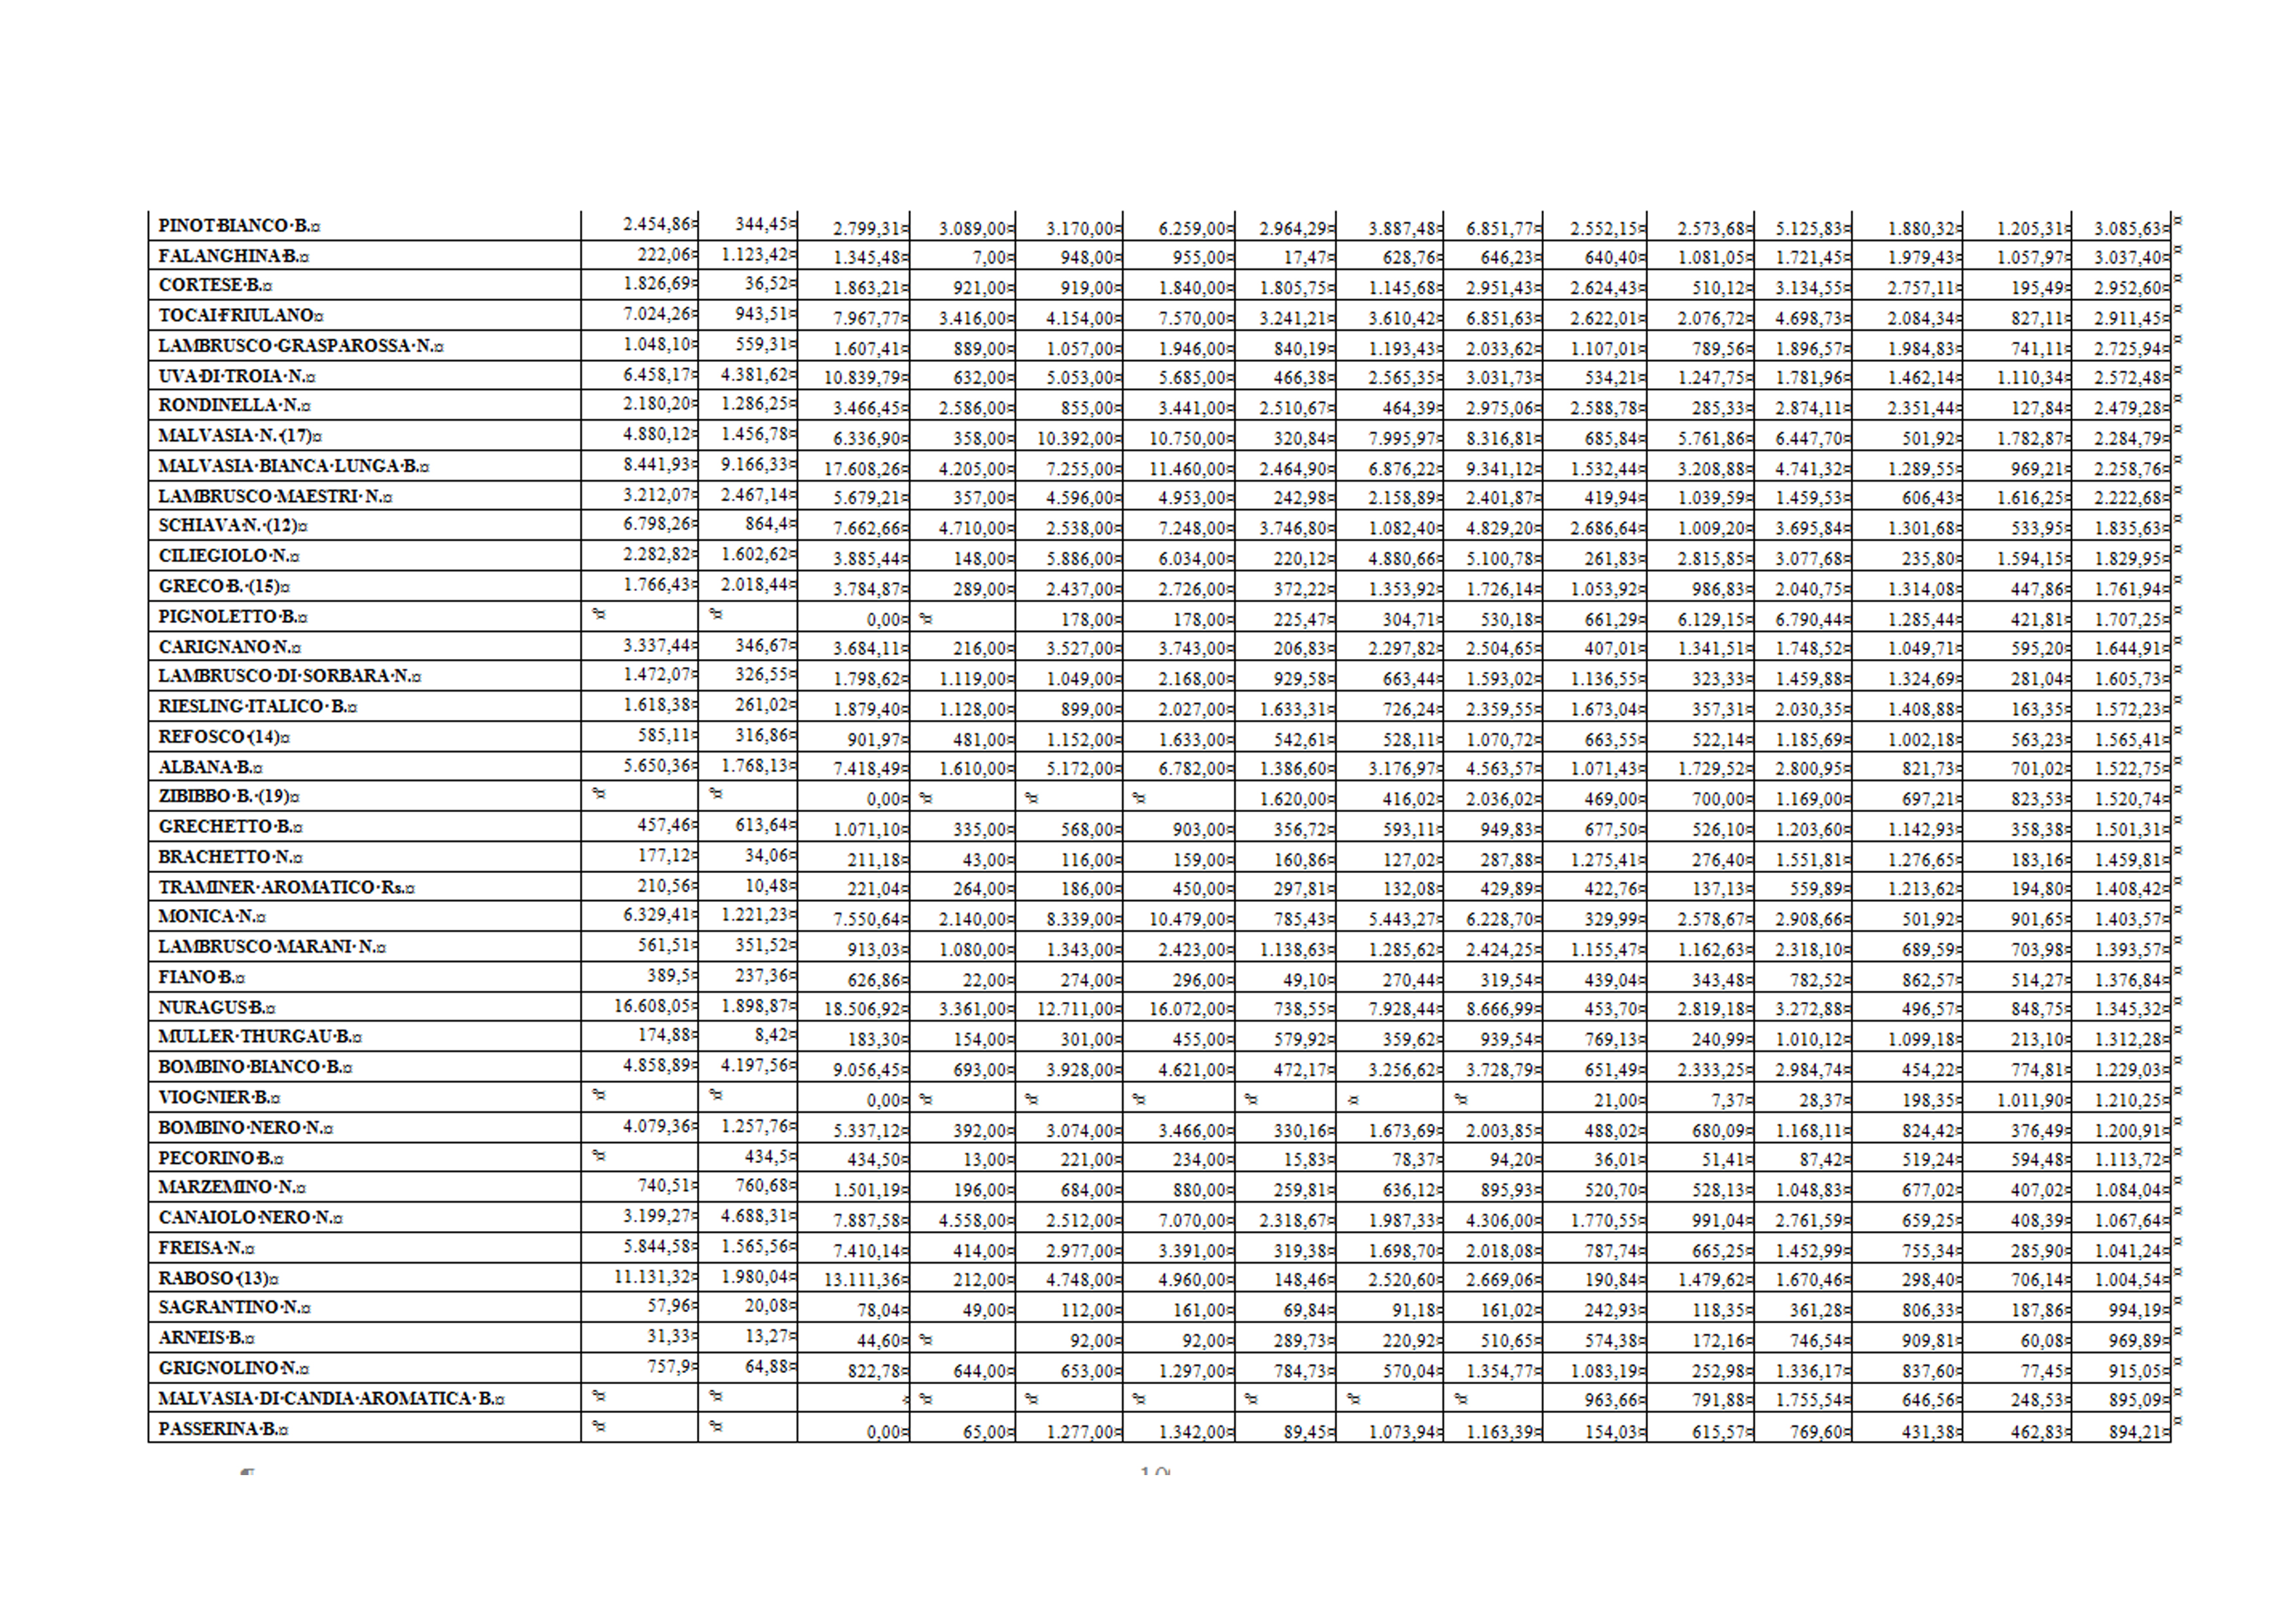
Table 5b. More important wine varieties grown in Italy from 1970 to 2010 (ISTAT).

Table 5c. More important wine varieties grown in Italy from 1970 to 2010 (ISTAT).
CONCLUSION
The changes to the acreage of the vine varieties for wine production are described by the means of the data supplied by the decennial censuses of agriculture. Availability of records concerning a period of time of 40 years allows to perceive the trends of viticulture that, obviously, are linked to those of production of wine. The national vineyard continues to shrink but at a slower pace in comparison to the past decades. Anyway such reduction, that depends also on the grape and wine producing structures and on the stiffness of the EC rules as for the enlargement of the acreage devoted to vine, affects in different ways the varieties under cultivation. Generally speaking the varieties that give back revenue, replace the less interesting under the economical point of view. The varieties more grown are the autochthonous ones. Some of them have been the same all along the decades considered. Some other are emerging since 2000 and, due to the actions for bettering the PDO of the concerned wines, are widening their growing area. The occurrence and enlargement of the cultivation of some foreign varieties, mainly of French origin, is registered mostly in Regions where the production of PDO wines is already well established. In general the Italian viticulture strongly tends towards a steady improvement of wines obtained either by autochthonous and international varieties.